Did you know that optical fibers embedded in aging buildings and bridges can enable proactive maintenance, improve safety, and extend its life? Learn more about this and other exciting infrastructure research and innovation in our new column The 5 Coolest Things in Infrastructure This Week.
Today we also explore how digital twins and other digital models can help us better understand earthquakes, protect aging sewer systems from storm surges in large cities like New York, and illustrate the benefits of “damage-preventing infrastructure,” including one hurricane-prone city’s $31 billion proposal.
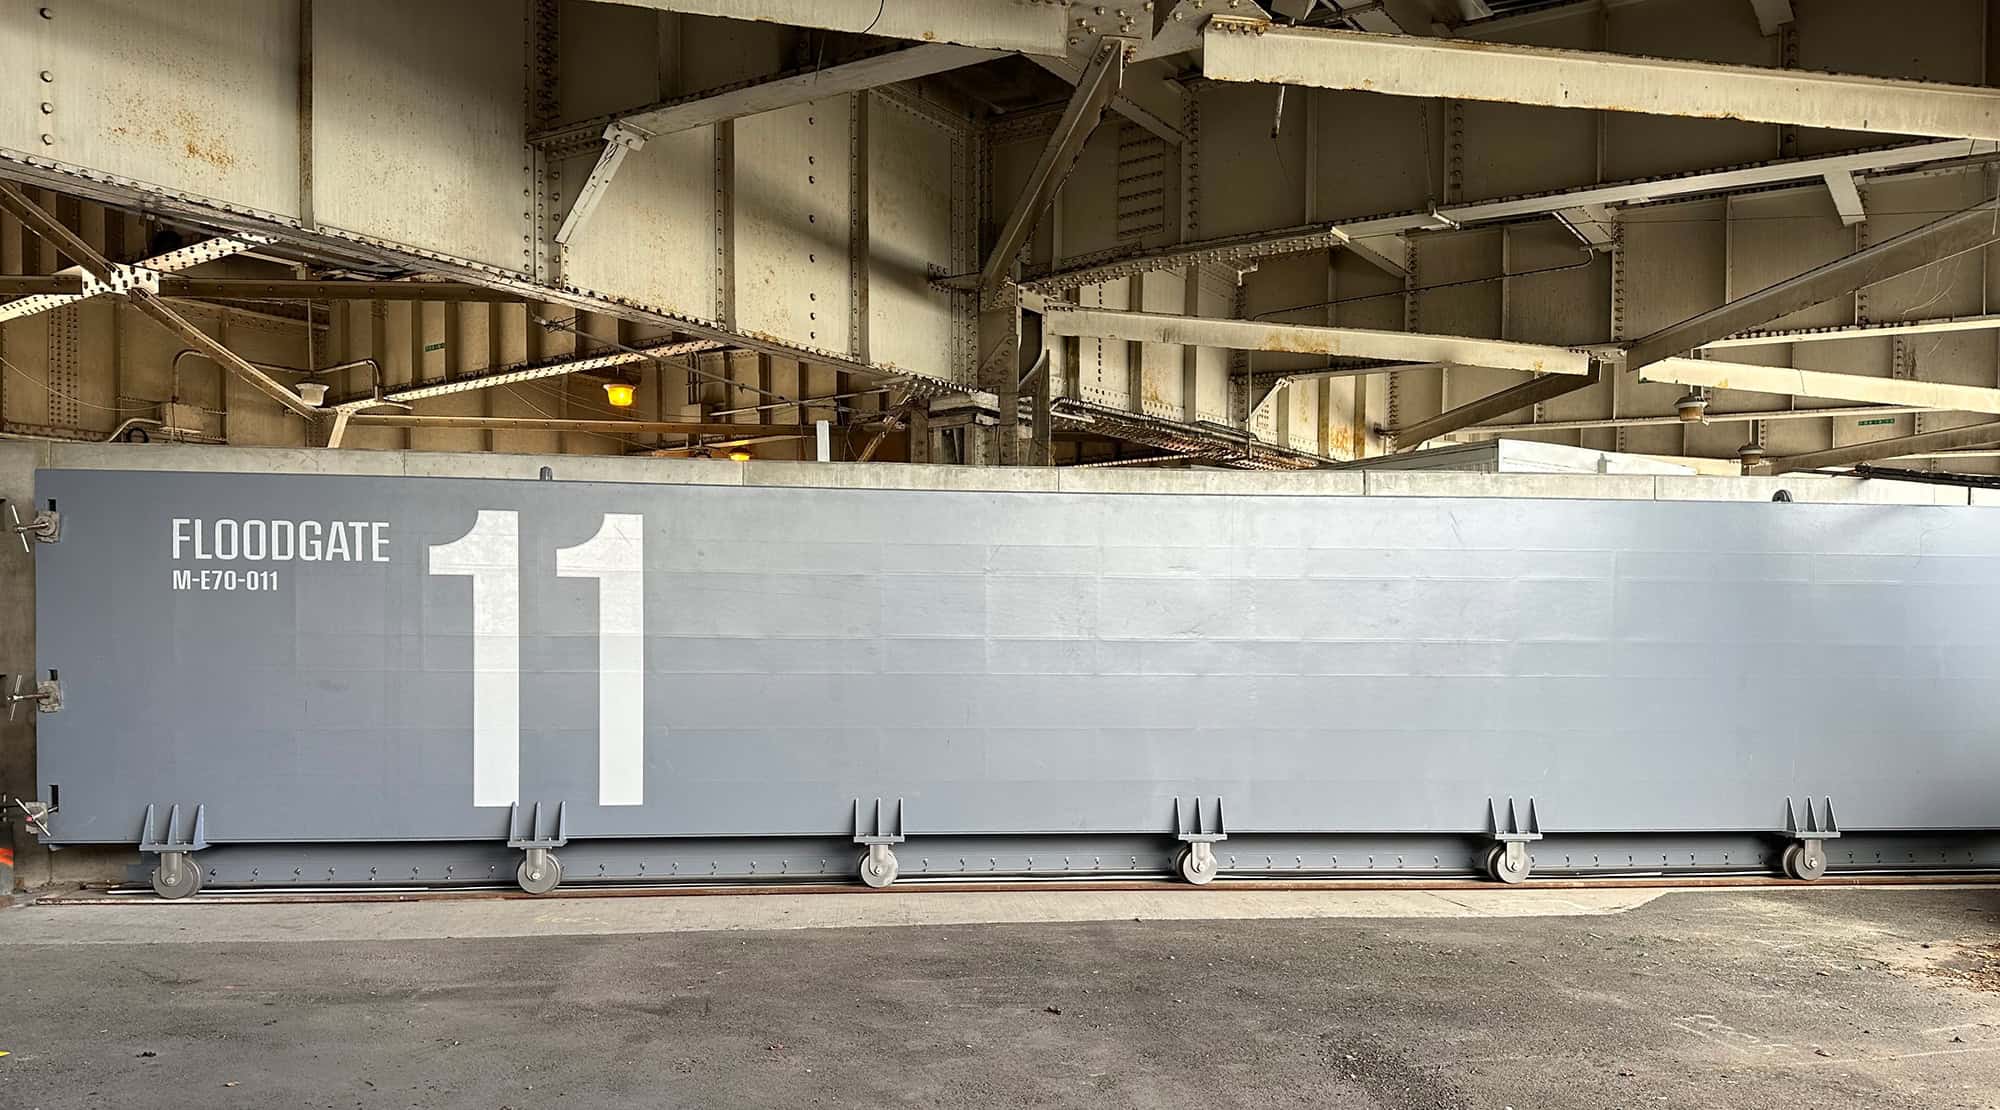
1. Shedding New Light On Aging Buildings
 Optical fiber sensing gives engineers real-time data about the structural behavior of buildings, bridges or pipelines.
Researchers from Japan’s Shibaura Institute of Technology (SIT) and Yokohama National University have found a new way to harness light scattering in optical fiber to monitor the structural integrity of aging buildings. Optical fiber sensing gives engineers real-time data about the structural behavior of buildings, bridges or pipelines. The technology can help spot problems early, enable proactive maintenance, improve safety, and extend the life of buildings and infrastructure.
Why does it matter?
Determining the health and safety of aging buildings can be difficult. This latest innovation, reported in the journal Scientific Reports, could revolutionize structural health monitoring by providing real-time data on the condition of critical infrastructure, helping to prevent failures and reduce maintenance costs. “Aging and seismic damage to civil infrastructure present significant societal challenges,” said Heeyoung Lee, an associate professor at SIT. “Optical fiber sensing technology offers a promising solution for monitoring the structural integrity of these infrastructures.”
2. Town And Country
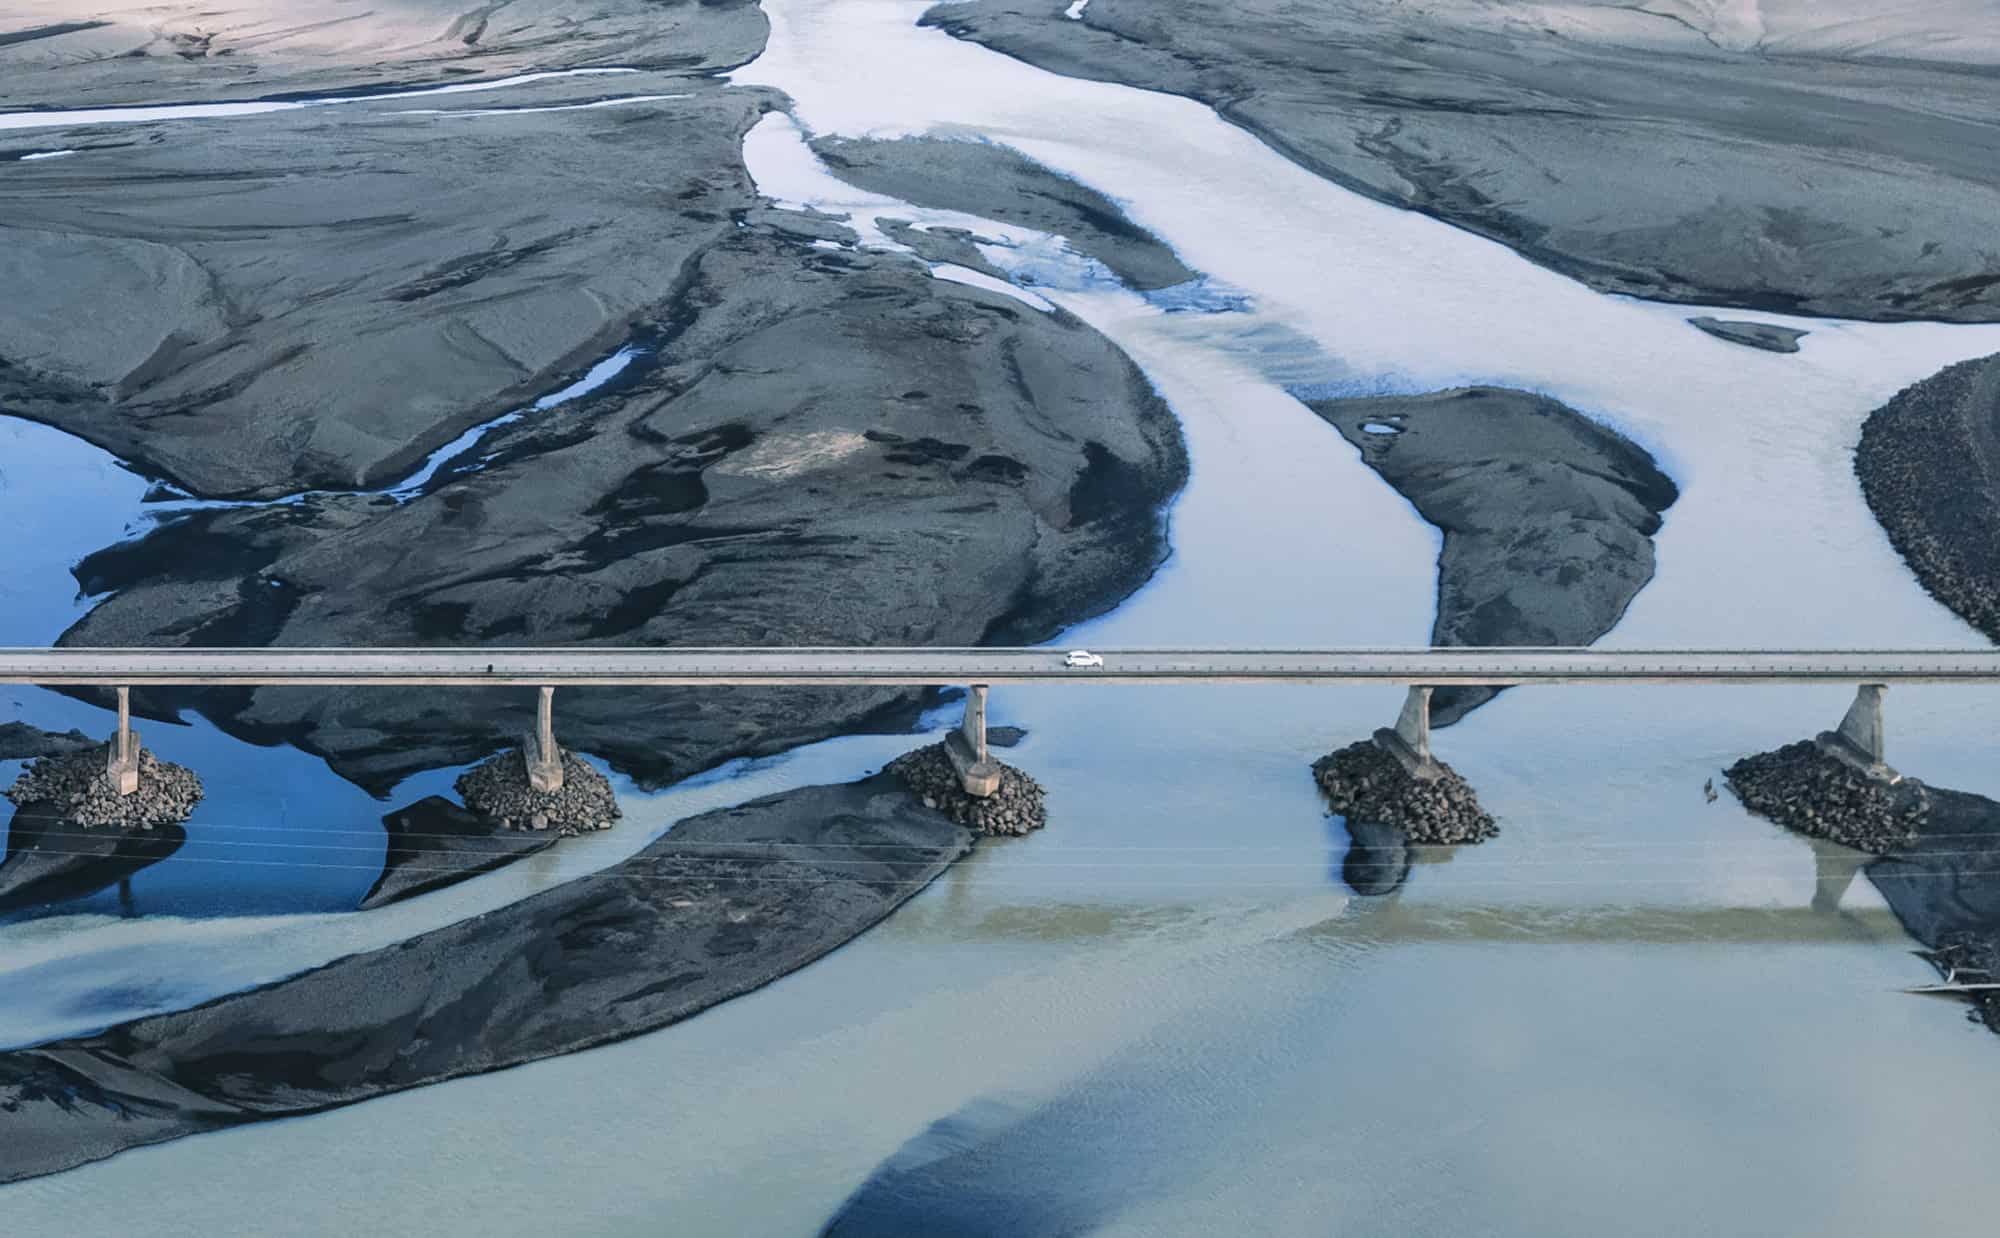
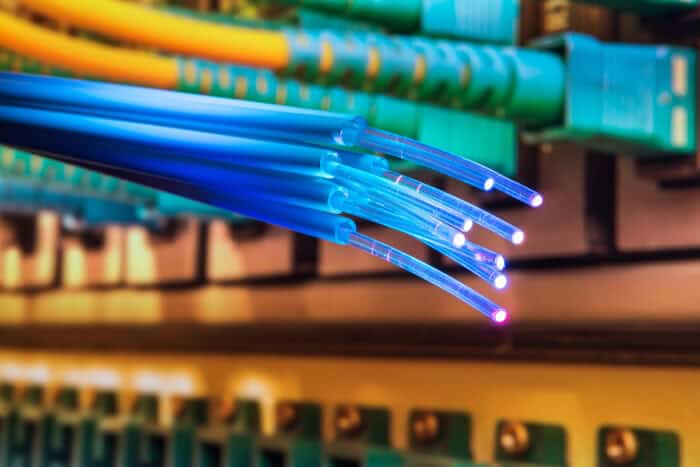
 Rendering of Europe and surrounding regions, showing urban-rural linkages. Image credit FAO.
A new study from the United Nations shows how the strategic shape of urban areas affects smaller towns and rural areas. The U.N. Food and Agriculture Organization (FAO) studied more than 30,000 urban centers and found that large cities can be “less relevant than smaller ones in engaging populations.” The paper, published in the journal Nature Cities, notes that more than 5 billion people – about two-thirds of the world’s population – live within an hour of an urban center with a population of at least 250,000. “Of these (people) , about half have access to more than one urban center, relying on smaller nearby centers for basic services,” the U.N. reports.
Why does it matter?
The FAO said the findings have “major ramifications for policy makers and planners” deciding where to locate various services, from specialized hospitals and international airports to cultural institutions, supermarkets and employment opportunities. “This unprecedented dataset offers a powerful tool for understanding how societies are organized around urban centers, unlocking new insights for sustainable development strategies,” said lead author Andrea Cattaneo, senior economist at the FAO.
3. Hurricane Watch
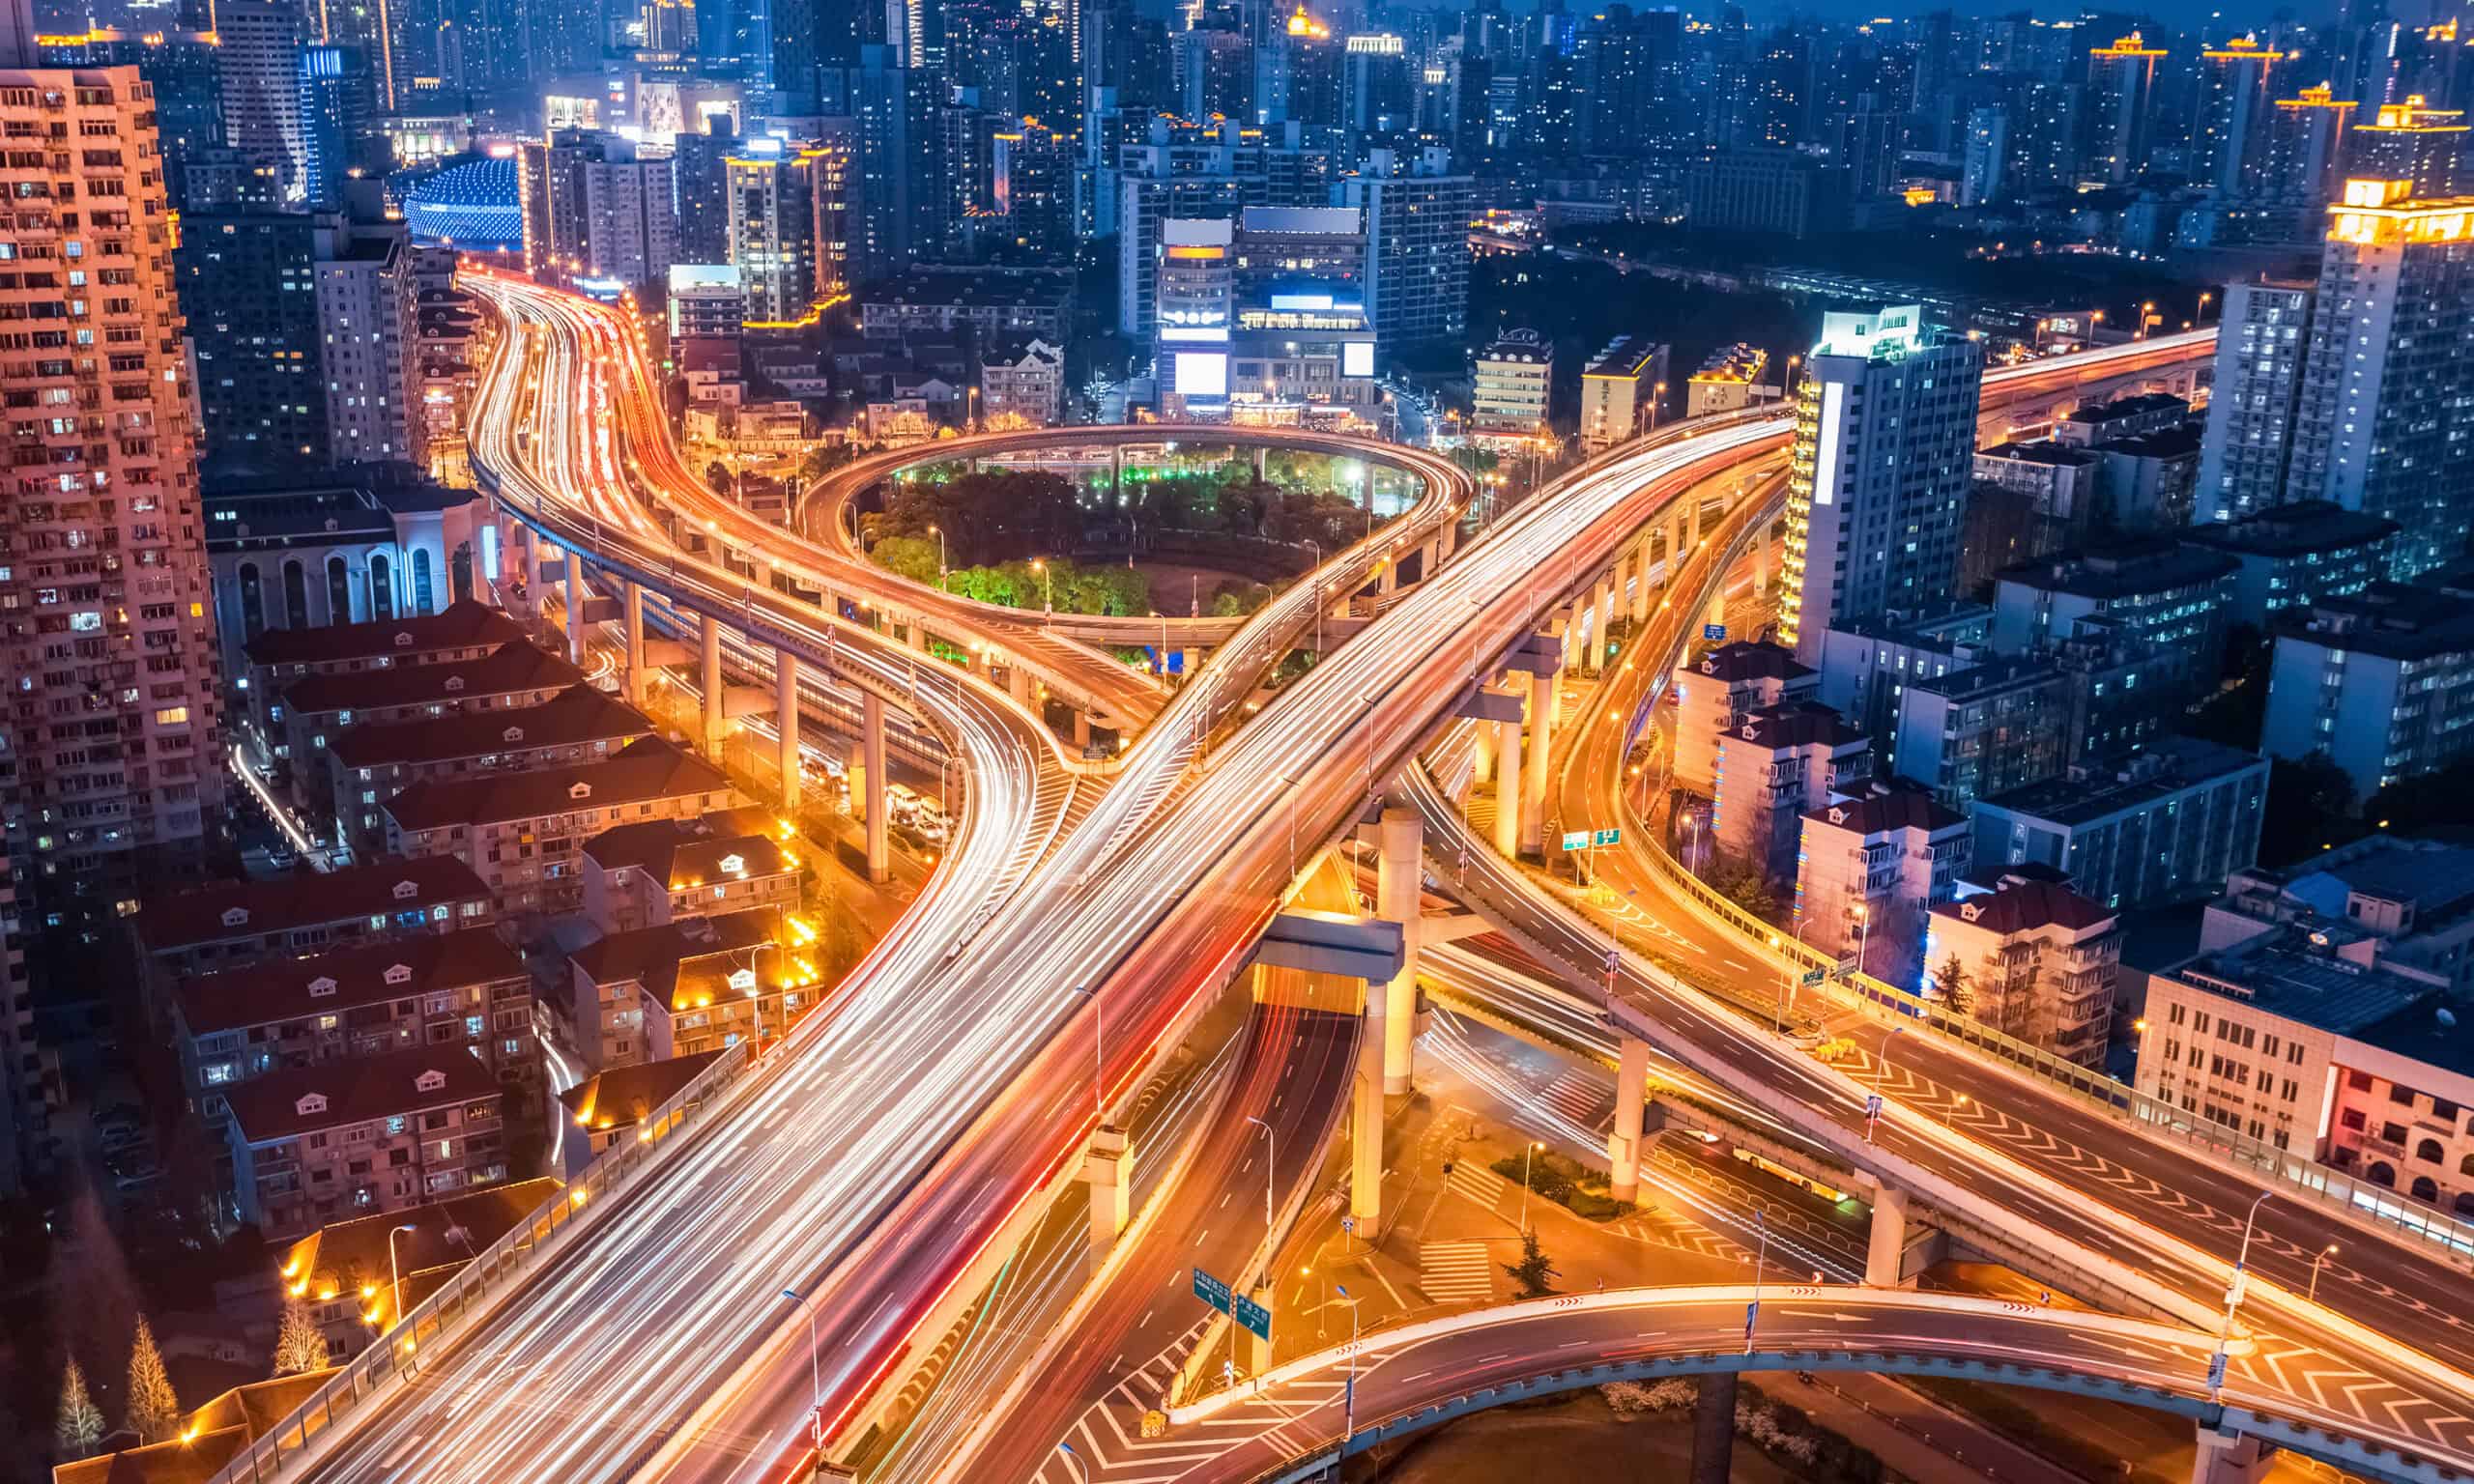
Researchers at Texas A&M University are using 3D visualizations to predict and prevent hurricane damage, including analyzing potential damage to infrastructure and homes – even as small as damage to basements and windows. The technology can also illustrate the benefits of “damage-preventing infrastructure,” like a proposed $31 billion coastal barrier to help protect Galveston, Texas. The island city was devastated by Hurricane Ike in 2008 (hence the project’s nickname, “Ike Dike”) and remains highly vulnerable to storm surge flooding from hurricanes in the Gulf of Mexico. The study was published in the journal Urban Informatics.
Why does it matter?
3D modeling and visualization technologies can help simulate damage caused by severe storms, rising sea levels, record-breaking rainfall and other extreme weather events linked to climate change. Xinyue Ye, a professor at Texas A&M’s School of Architecture, said 3D visualization of hurricanes and storm surges “allows us to understand how flooding will impact our coastal communities by allowing us to vividly see how each building and road might be impacted by a given flood.” By seeing what’s coming, storm watchers, emergency response teams and community members can better plan and prepare. “3D visualization serves as a universal language, bridging diverse disciplines and fostering communication between academia and the general public,” Ye said.
4. The Great Stink 2.0?
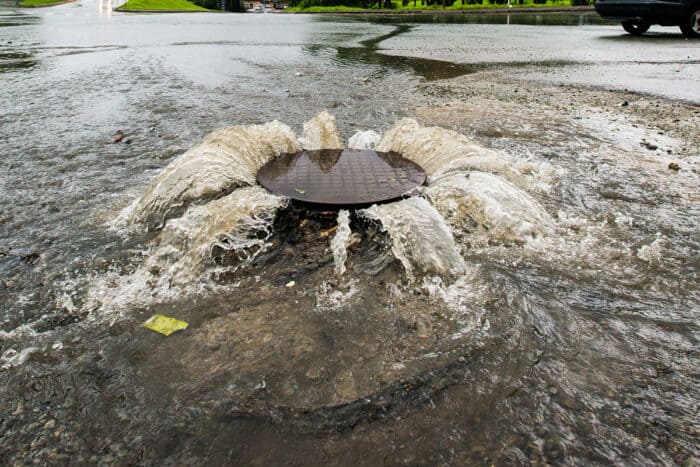 Researchers from Drexel University in Philadelphia used modeling technology to study the impact of sea level rise, increased rainfall and flooding on cities with aging combined sewer systems.
A team from Drexel University in Philadelphia is using modeling technology to study the impact of rising sea levels and increased rainfall on cities with aging “combined” sewage systems – where the same pipes collect both sewage and storm water. When storms hit, these combined systems initially dumped their contents into streams and rivers, but the 1970 Federal Pollution Control and Clean Water Act directed operators to divert their flow to wastewater treatment facilities. However, as climate change causes more extreme rainfall and rising sea levels, excess water is now causing these systems to back up. Drexel researchers used “detailed hydrologic and hydraulic models of flooding and combined sewer overflows” to study the problem in a section of the coastal city of Camden, New Jersey. Their aim was to better understand the challenges and potential solutions. They published their research in the Journal of Water Management Modeling.
Why Does it matter?
Coastal cities with combined systems, including Philadelphia, New York and Boston, are at risk for a major public health crisis. “Climate change is making what was already a difficult problem even more challenging,” Franco Montalto, a professor in the Drexel College of Engineering, said in a recent article. “The combination of sea level rise and precipitation intensification is particularly difficult for urban stormwater managers because it means the combined sewer system is being loaded from both sides,” Montalto said. “In many cases, there’s no place for the water to go but up and out onto the street, creating environmental and health risks.”
5. Earthshaking Science
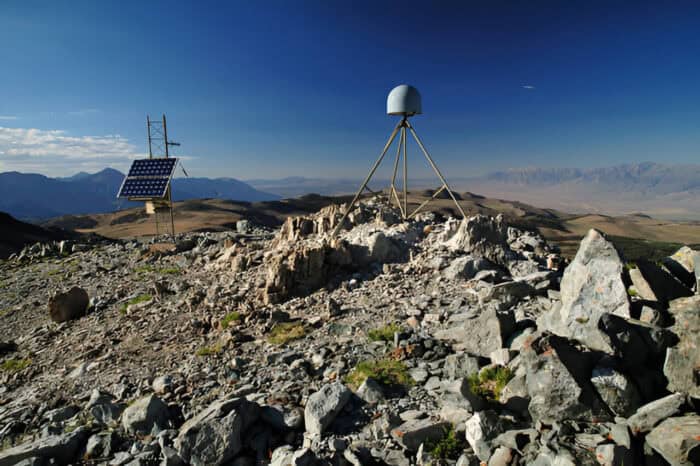 A new computational technique called deformation imaging is being used to study the rigidity of Earth’s crust and mantle. Image credit: University of Texas at Austin
Scientists at the University of Texas at Austin are using a new computational technique called deformation imaging to study the rigidity of Earth’s crust and mantle. The researchers report that the new method “could be an important step to building digital twins of the Earth,” and their goal is to better understand how earthquakes and other large-scale geological processes work. The imaging treats the planet as if it were “a simplified elastic material, while allowing its elastic strength to vary in three dimensions.” The university said the model computes the subsurface rigidity based on how much GPS sensors move in relation to one another during an earthquake. The result is a 3D picture of Earth’s interior based on changes on the surface. A recent study of an earthquake in Japan imaged “the subsurface down to about 100 kilometers underground,” the university said.
Why does it matter?
“Material properties like rigidity are critical to understand the different processes that occur in a subduction zone or in earthquake science in general,” said Simone Puel, who developed the method for a research project at the University of Texas Institute for Geophysics while in graduate school at the university’s Jackson School of Geosciences. “When combined with other techniques like seismic, electromagnetic or gravity, it should be possible to actually produce a much more comprehensive mechanical model of an earthquake in a way that has never been done before.”