1. Defect Mapping and Quantification for Dams & Spillways
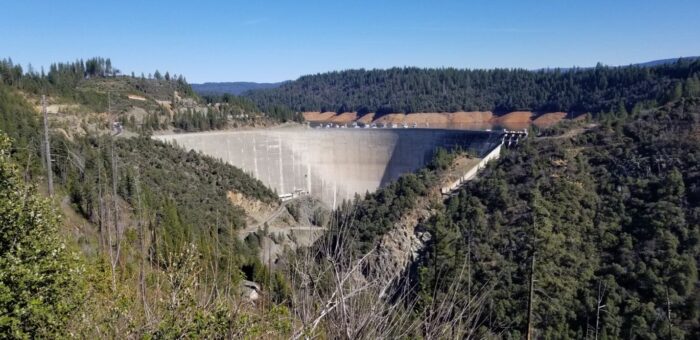
Dams are critical assets that provide flood control, hydroelectric generation, and water storage for our communities. However, as these assets continue to age, inspections are becoming even more important. Our clients tell us that dam and spillway inspections can be laborious, subjective, and difficult to reference through time. Sometimes the structure is so large that a detailed inspection of the entire asset is impossible! At NIRICSONTM, we developed a new inspection technique for dams and spillways to objectively monitor cracks, spalls, and delamination across the entire asset.
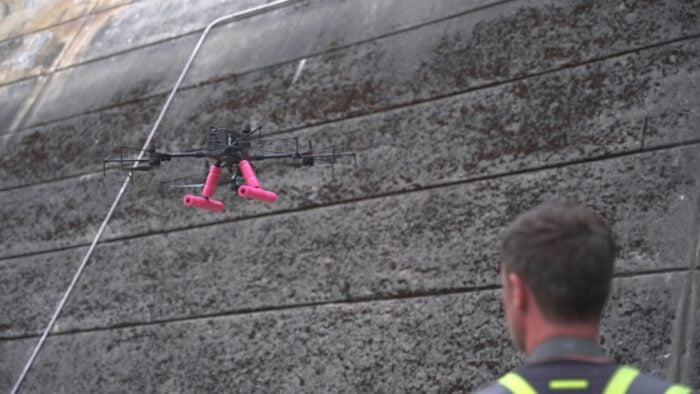
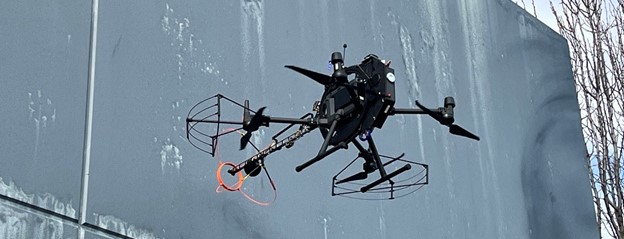
Dams Data Collection: NIRICSONTM uses a proprietary Data Collection Technology (NDX) and Data Collection Architecture DRONIC to collaborate with third-party UAVs and their own robotics technology to collect high-resolution and high-fidelity data from concrete structures.
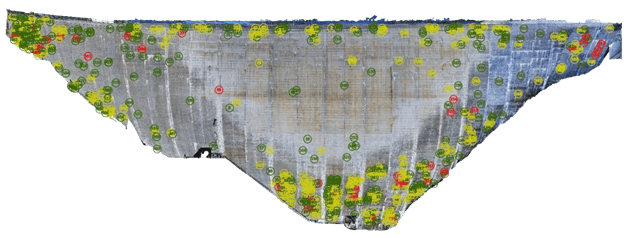
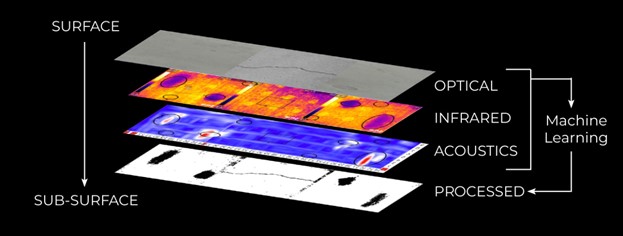
Data Processing: NIRICSON™ processes optical, thermal, and acoustic data collected by our third-party partnering Unmanned Aerial Vehicle (UAV) service providers. This data is analyzed by AUTOSPEXᵀᴹ to build an interactive baseline condition map for the entire structure.
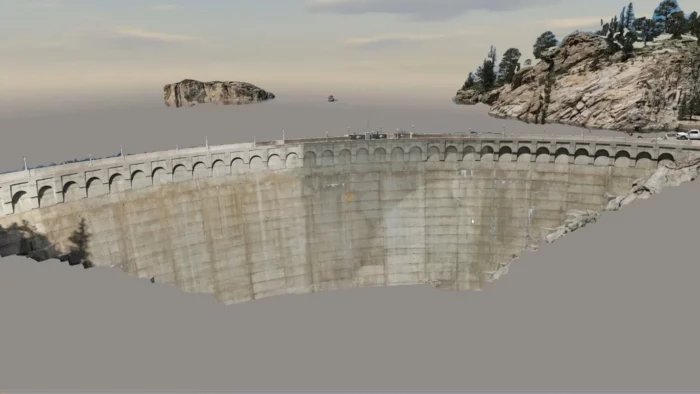
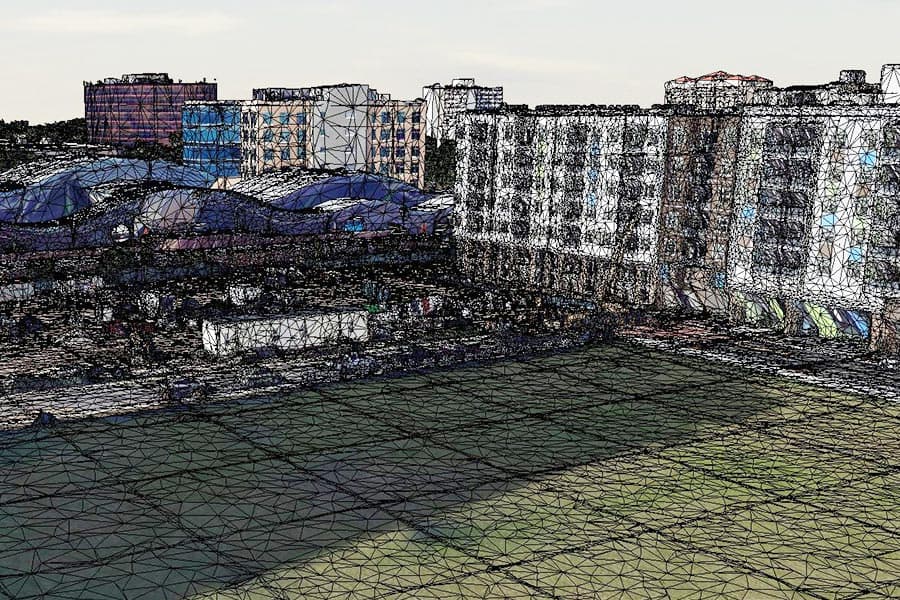
Using machine learning and photogrammetry, NIRICSONTM uses the power of Bentley’s ContextCapture to develop high resolution 3D models of the asset.
Outcomes: Niricson then converts the structure into 2D based on the finite element, and With AUTOSPEXᵀᴹ, Dam owners can easily navigate their structure, interact with the detected defects, and quantify the cracks, spalls, leakage, and delamination on the concrete. This dataset allows asset owners to quantifiably monitor their structure over time, conduct detailed structural analyzes, and estimate the amount of material for asset repairs. Engineers can also bring the files into CAD to overlay the condition assessment layers on their as-built engineering drawings, conduct CFD, or identify potential failure modes and estimate repairs.
Benefits: Our cloud-based platform allows clients to visualize and overlay defects discovered by optical, thermal, and acoustic analyses, providing a baseline assessment of the structure, which can be tracked over time. All in all, this leads to:
- Change Detection
- Detailed Documentation
- Enhanced Maintenance Planning
- Simpler, Safer & Faster Inspections
Challenges:
- Sharp contrasts in lighting for the entire structure
- GPS denied poses challenges depending on the type of UAV platform
2. Defect Mapping and Quantification for Bridges
Traditional bridge inspection methods often involve boom lifts, UBITs, snooper trucks, rope access, or scaffolding, often resulting in a laborious and subjective condition assessment that puts personnel at risk. The solution developed by NIRICSON™ eliminates the need for heavy equipment like scaffolding and cranes and allows engineers to objectively monitor defects across the entire structure.
Data Collection: NIRICSONTM uses proprietary Data Collection Technology and Architecture DRONIC with third-party UAVs and their own robotics technology known as NCX to collect data.
Data Processing: NIRICSON™ processes optical, thermal, and acoustic data collected by our third-party partnering Unmanned Aerial Vehicle (UAV) service providers. This data is analyzed by AUTOSPEXᵀᴹ to build an interactive baseline condition map for the entire structure.
Outcome: With AUTOSPEXᵀᴹ, Bridge owners can easily navigate their Bridges, interact with the detected defects on each element, and quantify the cracks, spalls, leakage, and delamination on the concrete. This dataset allows asset owners to quantifiably monitor their structure over time, conduct detailed structural analyses, calculate section loss, and estimate the amount of material for asset repairs.
Benefits: Our cloud-based platform allows clients to visualize and overlay defects discovered by optical, thermal, and acoustic analyses, providing a baseline assessment of the structure on a per-finite-element-basis, which can be tracked over time. Additional benefits include:
- Reduced Traffic Control
- Detailed Documentation
- Change Detection
- Enhanced Maintenance Planning
- Simpler, Safer & Faster Inspections
Challenges:
- Sharp contrasts in lighting for the entire structure
- GPS denied poses challenges depending on the type of platform

