Turn connected project data into clear, immersive experiences that improve stakeholder alignment and accelerate decision-making.
Infrastructure teams are generating more data than ever before. Digital twins, BIM models, reality meshes, 4D schedules, and geospatial data are now defining how projects are designed and delivered. Tools like iTwin Engage are helping teams turn that data into real-time visual experiences that improve stakeholder understanding and decision-making.
Yet one critical gap remains—turning that connected data into something stakeholders can use and understand. Visualization bridges the gap between complex data and confident decisions, which can often slow teams down, limit collaboration, and introduce risk across the project lifecycle.
The visualization gap in infrastructure today
Despite advances in digital engineering, many infrastructure teams struggle with visualization workflows that were never designed for today’s scale, speed, or expectations.
High-quality visualization often requires specialized skills, advanced rendering tools, and considerable time investment. As a result, engineers and project teams sometimes need to rely on third-party experts and consultants to translate project models into useful visuals.
This creates bottlenecks that delay communication, increase cost, and limit how often visuals can be updated. Instead of being a continuous part of collaboration, visualization becomes just a one-off deliverable.
Static visualizations slow project decisions
Infrastructure projects are constantly evolving. Designs change, schedules shift, and field conditions are updated. Yet visualization workflows remain inflexible and static. Teams export models, rebuild scenes, and recreate presentations manually. By the time visuals are shared, they are already outdated, creating a disconnect between what stakeholders see and what is happening.
Consider a common construction scenario. A project team updates a 4D schedule late in the week. The sequencing changes, site logistics shift, and dependencies are adjusted. The visualization team must rebuild scenes, reapply context, and regenerate animations to reflect the new plan. By the time updates are ready, the schedule has already evolved again.
In this case, visualization becomes a lagging process that cannot keep pace with construction reality.
Make complex infrastructure data easier to understand
Even the most detailed models fail when stakeholders cannot interpret them. Non-technical audiences struggle to understand engineering data without the right context, which leads to confusion during reviews, slower approvals, and reduced confidence.
This becomes clear during executive reviews. Teams present technical models or static visuals, and stakeholders ask how the project will look, how construction will progress, and what has changed. Instead of driving decisions, meetings shift into explanation mode.
Add real-world context without disconnected tools
Traditional visuals often lack real-world context, and without geospatial surroundings, lighting, and human-scale elements, stakeholders cannot fully grasp how a project will look or behave.
At the same time, workflows span multiple disconnected tools. Data is exported, converted, and rebuilt across platforms, increasing effort and introducing risk. Visualization becomes more about managing files than communicating ideas.
Teams must choose between speed and accuracy. They can present quickly with outdated visuals, or spend time rebuilding content to reflect current conditions. Neither option supports confident decision-making.
These challenges are widely recognized in today’s infrastructure industry, and project teams are investing in digital twins to create a single source of truth, simplify workflows, and engage broader audiences.
The goal is simple: turn complex, connected data into a clear understanding that drives faster decisions. Visualization can no longer be the last step, as it has become vital to how teams align stakeholders and move projects forward.
How iTwin Engage Improves Infrastructure Visualization
iTwin Engage connects design, a digital twin, and construction workflows into a single visual experience. By leveraging iTwin data and extending insights from solutions like SYNCHRO, teams can move from disconnected models and schedules to a unified understanding of their projects.
iTwin Engage connects directly to iTwin data, eliminating manual exports and rework. Project visuals stay synchronized with the latest information, ensuring stakeholders always see the most accurate view.
With intuitive, no-code tools, engineers, planners, and project managers can create immersive visual content without specialized training. This expands access, speeds workflows, and enables more consistent communication.
Real-time infrastructure rendering with Unreal Engine
At the core of iTwin Engage is Unreal Engine, which enables high-fidelity, real-time rendering of massive infrastructure datasets. Teams no longer need to trade quality for speed. They can create cinematic, photorealistic visuals instantly from live project data.
Unreal Engine brings real-time rendering without long processing times, combined with high visual fidelity that enhances stakeholder understanding. It delivers smooth performance across large, complex environments and enables teams to create immersive, interactive experiences at true infrastructure scale.

Create context-rich infrastructure visualizations
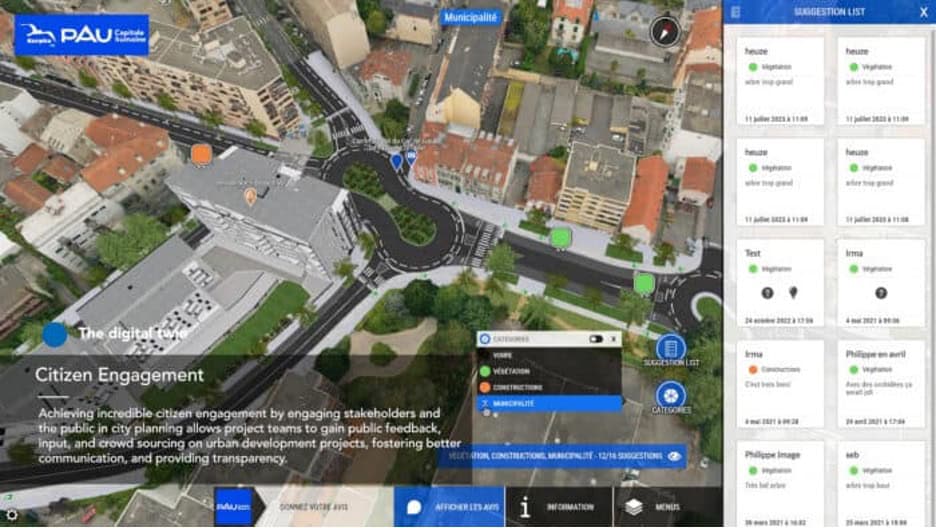
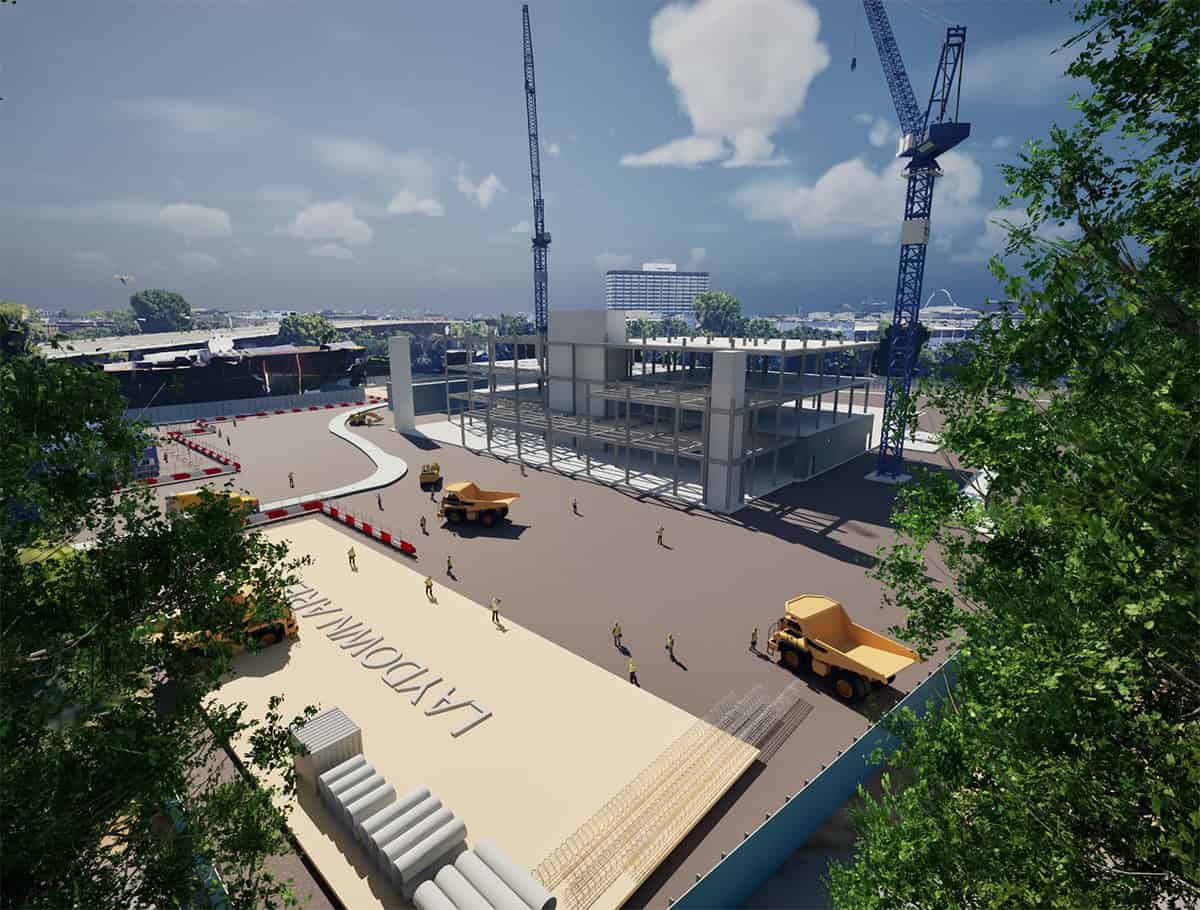
iTwin Engage allows teams to bring projects to life with real-world context and enhance scenes with vehicles, equipment, people, vegetation, and geospatial surroundings. Environmental controls such as lighting and weather create realistic, cinematic conditions.
These elements transform complex models into experiences that are easier to understand and more compelling to stakeholders.
Built for infrastructure and 4D understanding
iTwin Engage is built for infrastructure scale, leveraging open standards like OGC 3D Tiles to efficiently stream large datasets while maintaining geospatial accuracy.
It also enables teams to visualize 4D construction sequencing over the entire project. Instead of relying on charts or static visuals, stakeholders can clearly see what happens, when it happens, and how phases interact.
When used alongside SYNCHRO, teams can transform 4D schedule data into immersive visual experiences that are easy to understand and share. Camera paths, annotations, and guided narratives help communicate sequencing, highlight risks, and align stakeholders.

Turn 4D construction data into visual understanding
Construction teams already have the project data they need. The challenge is communicating it.
iTwin Engage transforms 4D construction data into immersive visual experiences that make sequencing and project flow easy to understand. Stakeholders can explore how a project will be built, identify conflicts, and align execution strategies before work begins.
This improves coordination and helps teams move forward with confidence.
Improve stakeholder alignment and project outcomes
When these challenges are addressed, the impact is immediate. Stakeholders understand projects faster, design reviews move more efficiently, miscommunication decreases, and rework is reduced.
Teams shift from explaining complex data to showing it clearly. Visualization becomes a driver of alignment and progress.
As digital twins become standard, the real value lies in how effectively teams communicate what that data means and how it informs decisions.
Explore Infrastructure Visualization With iTwin Engage
Visualization is evolving, and teams need faster ways to turn complex data into a clear understanding and actionable insight. iTwin Engage is leading this industry shift and enabling infrastructure professionals to transform digital twin data into immersive, real-time experiences that improve communication, alignment, and decision-making.
See how iTwin Engage infrastructure visualization software helps teams turn digital twin and 4D construction data into immersive, real-time visual experiences that improve communication, alignment, and decision-making.