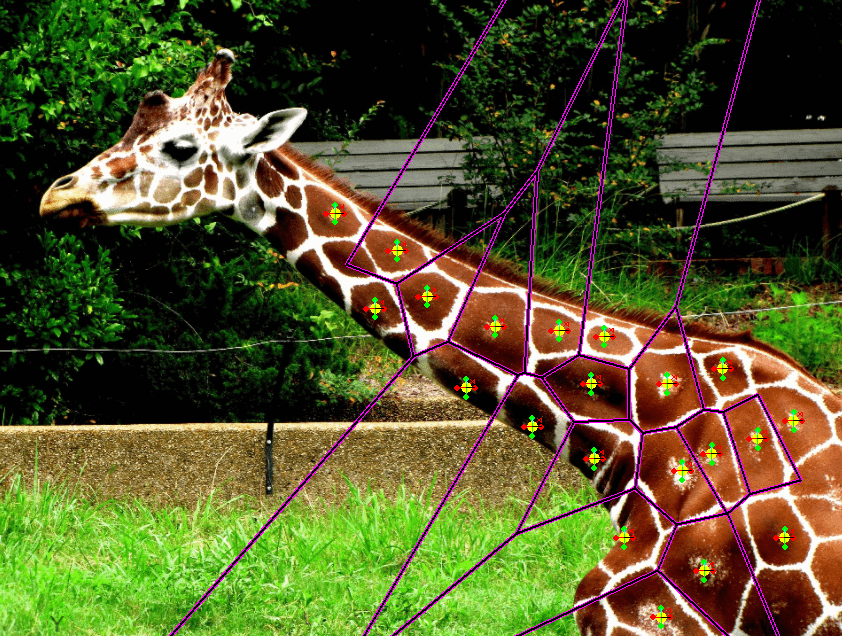
Voronoi Diagram or Voronoi tessellation is abundantly found in nature. There are also some examples in architecture where Voronoi is used. It’s not only the aesthetics that makes Voronoi diagram special but it has some unique properties that makes it very useful in solving real life problems.

(image source: https://quantdare.com/k-means-algorithm/giraffe-59009_1920/)
In this section, we will see how we can create Voronoi Diagram in GC and also how we can use its properties in solving some practical problems.
First let’s understand what is Voronoi diagram.
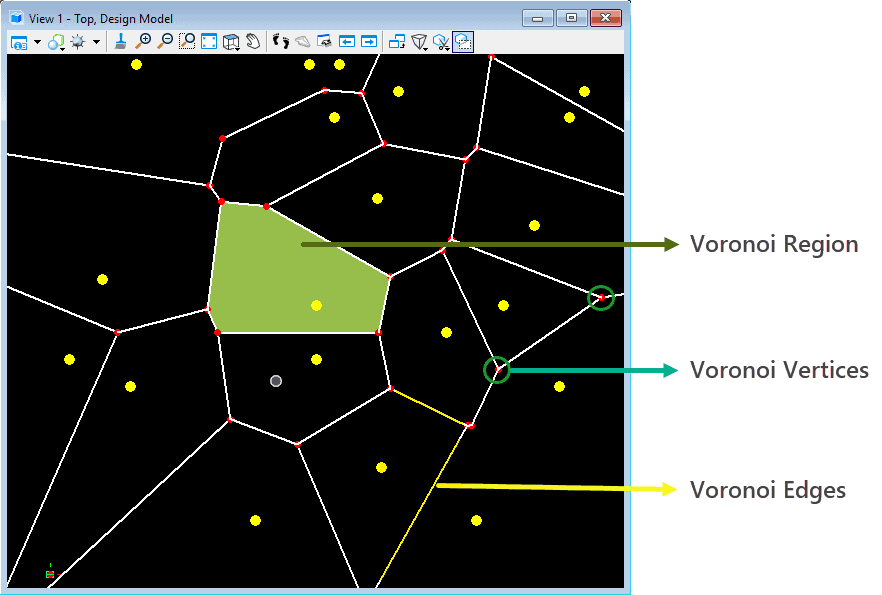
Now, imagine there are few points in a plane, we call it the Voronoi Sites. Thus, Voronoi diagram divides the plane in a set of regions based on the Voronoi Sites.
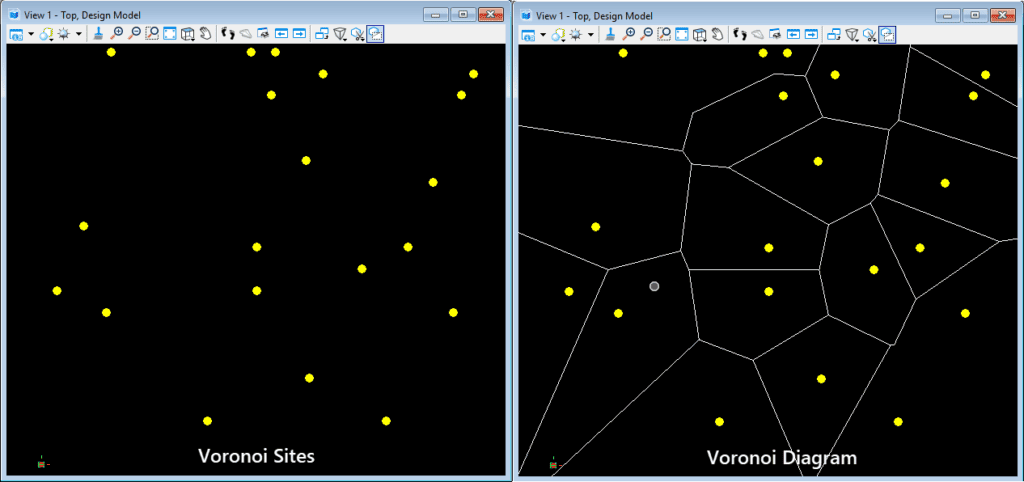
These regions are called Voronoi Region or Cells. Every cell is associated with its corresponding Voronoi Sites.
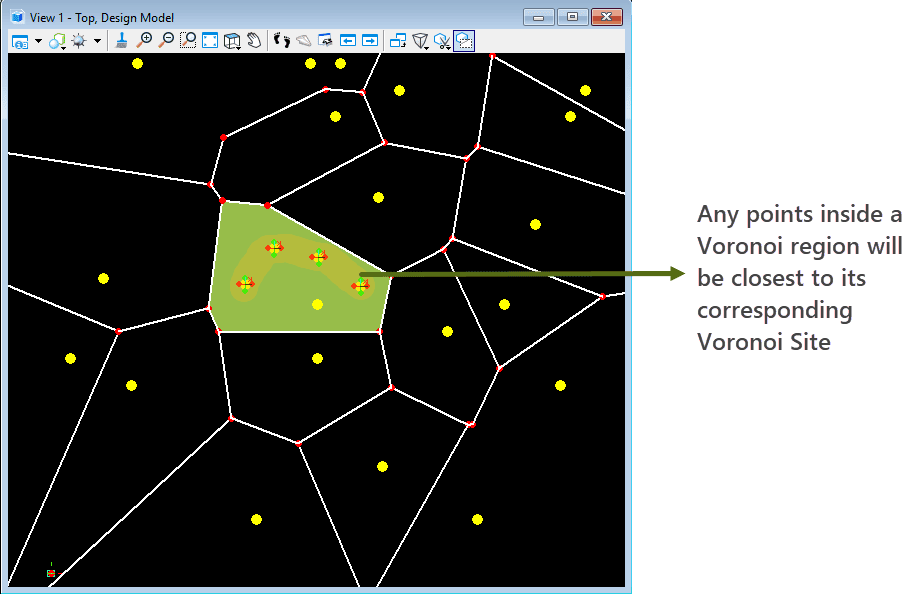
Any new points lying inside any Voronoi Cell will be closest to its corresponding Voronoi Site.
To create the Voronoi we will use the Generated-Node-Types(GNT) Voronoi. You can learn more about GNT from this wiki .
The node required some points as input. We can create some random points as shown in this wiki. These points will act as the Voronoi Sites.
Properties of Voronoi Diagram and Its Applications
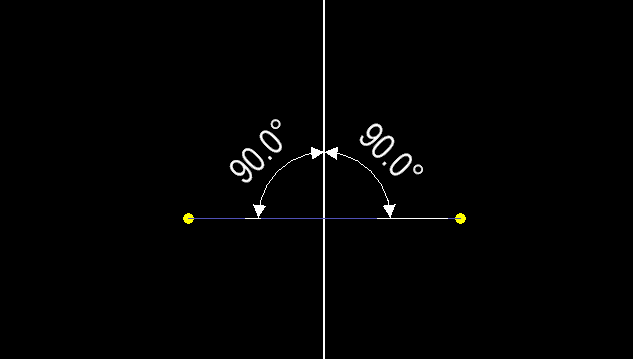
- A Voronoi Edge is a perpendicular bisector of two Voronoi Sites.

Now, imagine the Voronoi Sites as number of persons in an area. Now you want to traverse through this area with maximum possible social distancing from everyone. The path formed by the Voronoi edges will be the best path for this situation. Such paths are also helpful in motion planning for finding obstacle avoiding route.
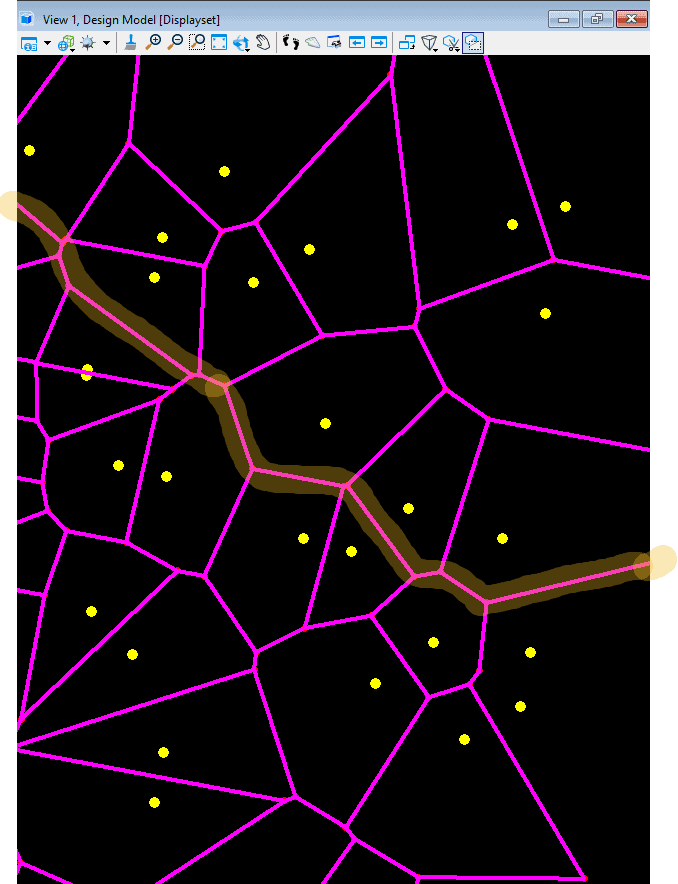
So, we can extract the Voronoi Edges as line segment with property ‘VoronoiEdges’ of the Voronoi GNT node.
- The point at which 3 perpendicular bisectors meet is a Voronoi Vertex and this vertex act as the center of an empty circle which only contains 3 Voronoi sites in the circle’s boundary. No other sites lie inside this circle.

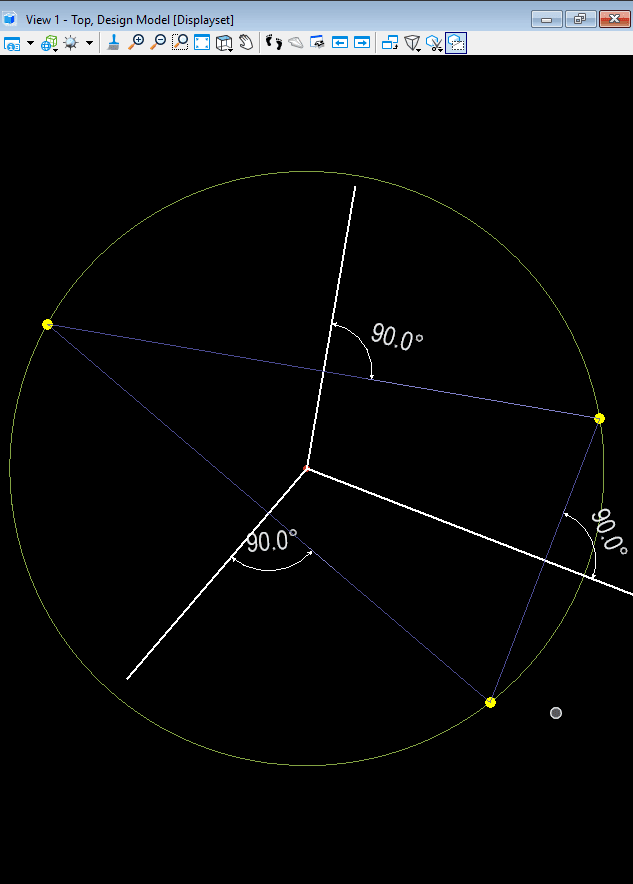
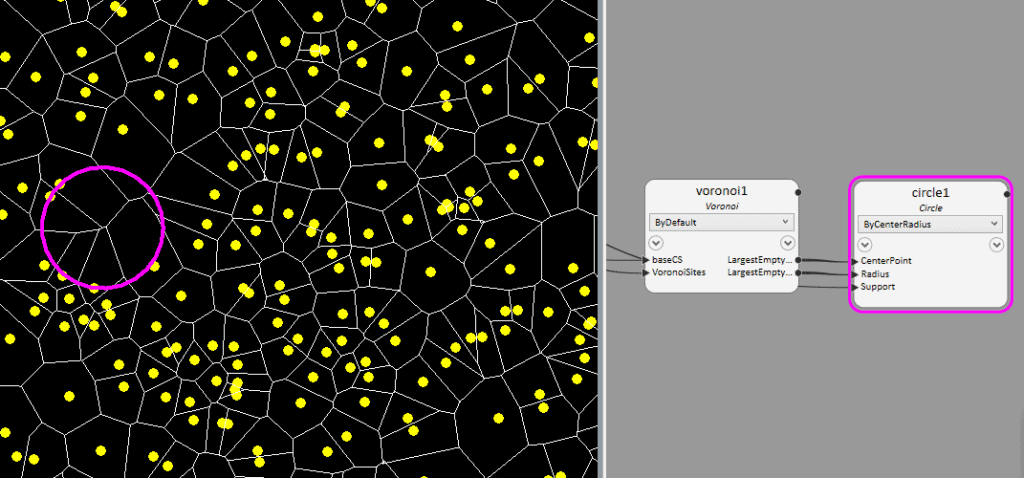
Imagine we want to set up a new food store and this store location should be furthest away from its competitor stores. Then the Voronoi Vertex with largest empty circle will be the ideal location to set up the store.
To find out this location we can use the property ‘LargestEmptyCircleLocation’. Also, for the radius of the circle there is can use the property ‘largestEmptyCircleRadius’. Similarly, there are also properties ‘SmallestEmptyCircle’ and ‘SmallestEmptyCircleRadius’. Note, this property always report circle center inside the Convex Hull.
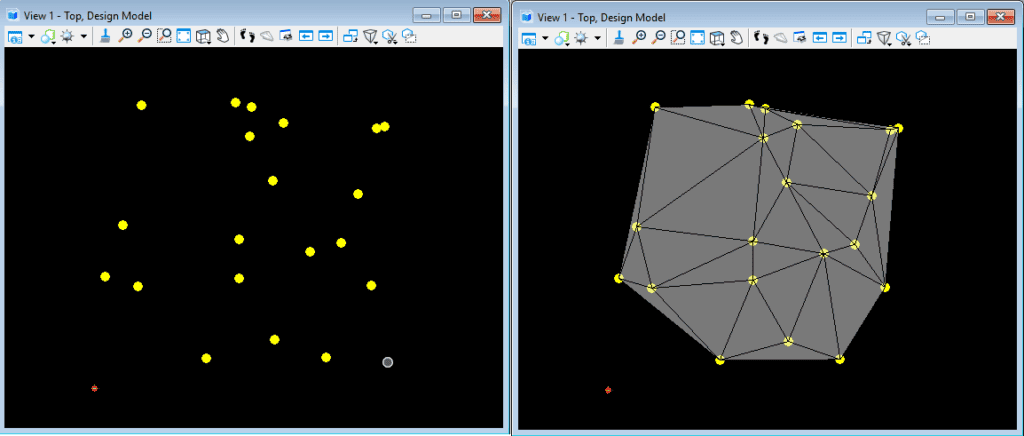
- Delaunay triangulation is the dual graph of Voronoi Diagram.
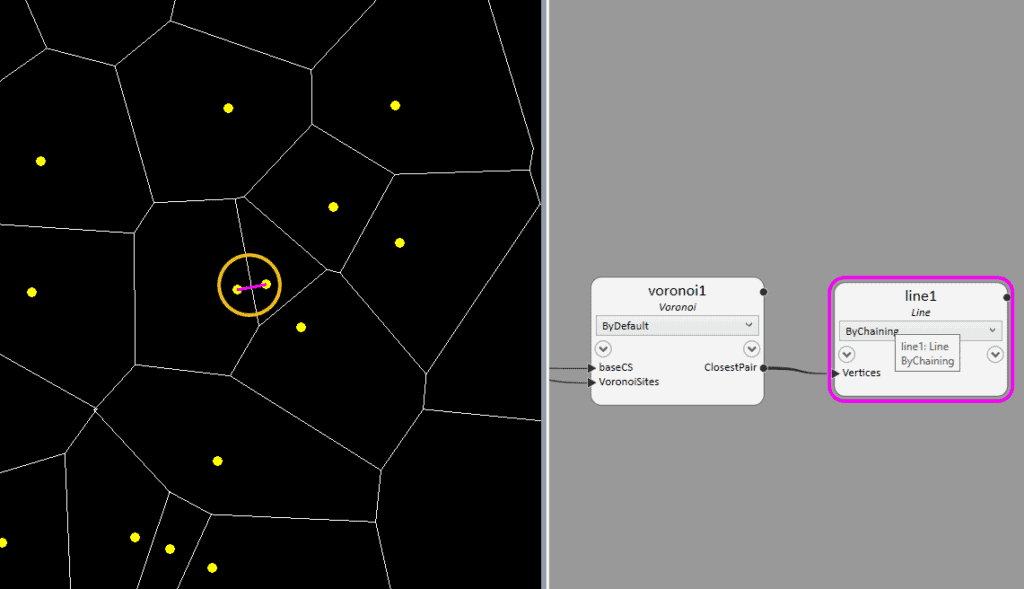
The pair of Voronoi Sites that form the shortest edge of this Delaunay triangulation is the closest pair.
To find the closest pair we can use the property ‘ClosestPair’.
Voronoi Implementation in GenerativeComponents
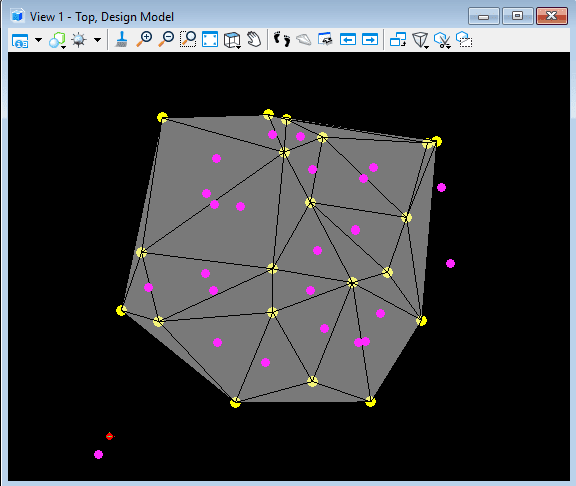
First, we create the Delaunay triangulation by using the Mesh Node.
Then we calculate the circumcenter of each and every triangle.
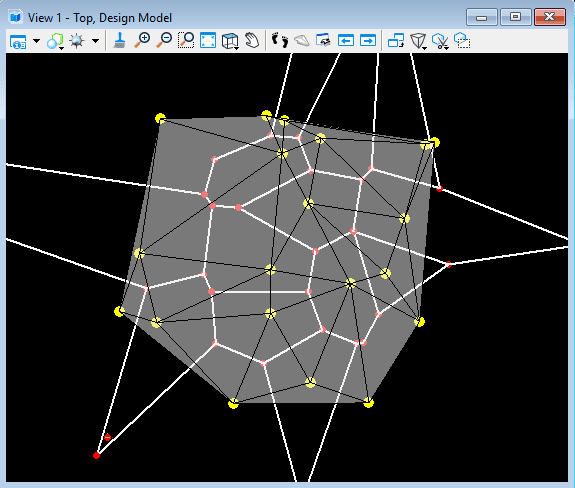
And, finally we connect the circumcenters with its adjacent circumcenters to get the Voronoi Diagram.
Limitations
- Even though we are able to query several useful information from the Voronoi Diagram in linear time complexity but the algorithm used here to generate the Voronoi Diagram has quadratic time complexity. A better alternative would be to use ‘Fortune’s Algorithm’.
- So, The efficiency of the Voronoi Diagram depends upon the quality of Delaunay triangulation. Delaunay triangulation needs to be formed properly. Otherwise similar to below issues may appear.

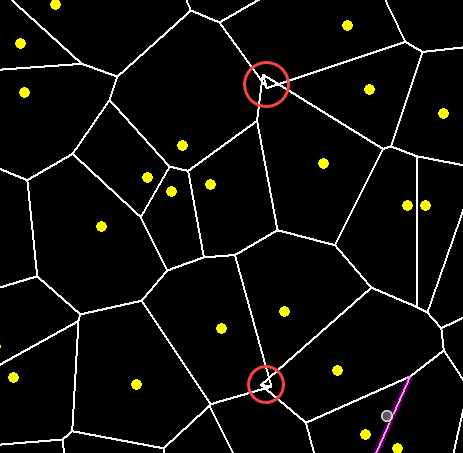
Also, to avoid such issues, we can change our point locations or regenerate the random points.
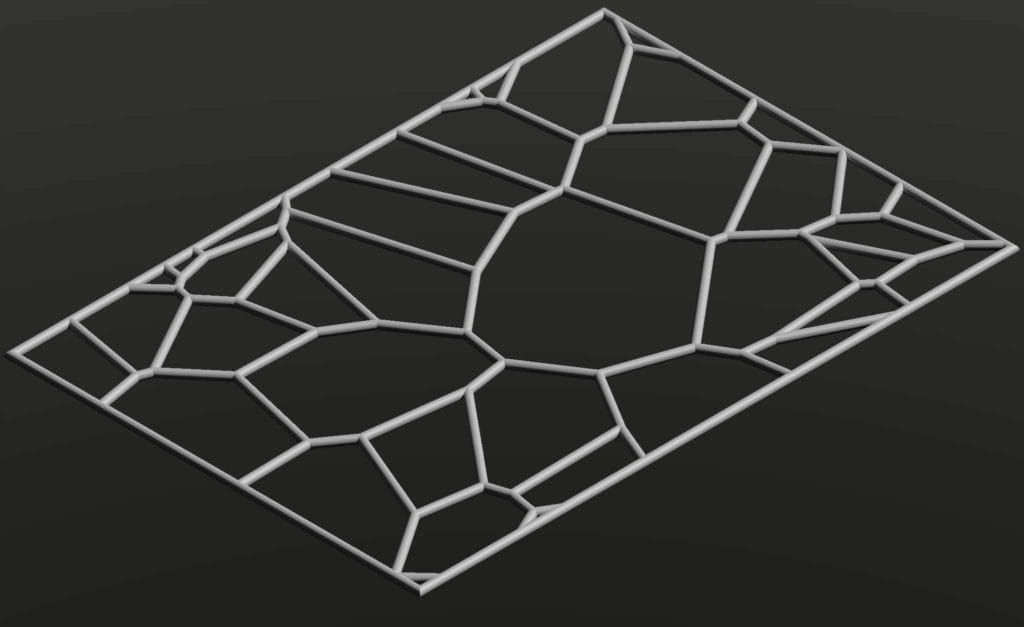
Additionally, an example of Façade generated using Voronoi Pattern.