Home / Software Posts / Soil Consolidation Analysis

Soil Consolidation Analysis

Bentley Expert Profile Image

Bentley Expert

geotechnical engineering detail of earth soil layers

Share

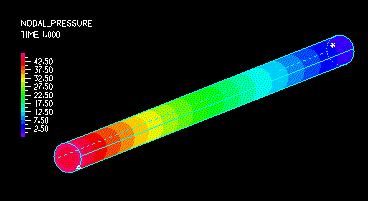
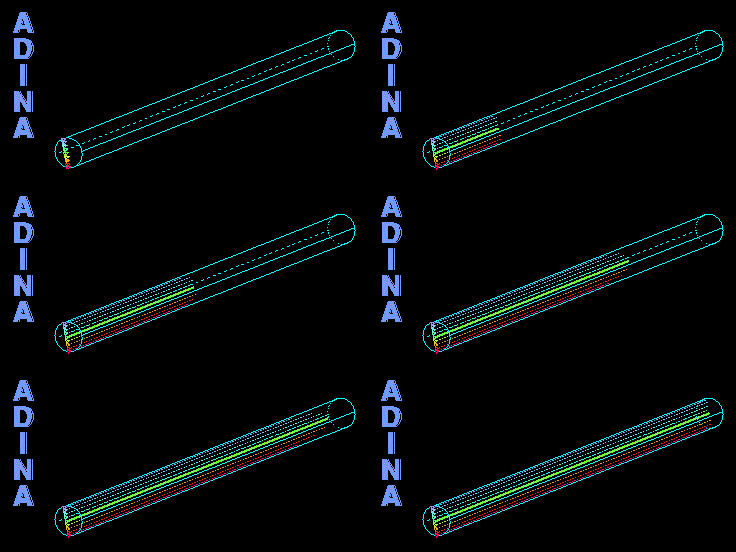
We present an analysis of turbulent flow in a straight pipe depicted in the animation and pressure drop diagram above. Although this problem can be solved more efficiently using 2-D axisymmetric elements, we used 3-D elements as a demonstration. The elements used are 8-node FCBI (Flow Condition Based Interpolation) and the turbulence model is the standard k-epsilon.


particles
pressure

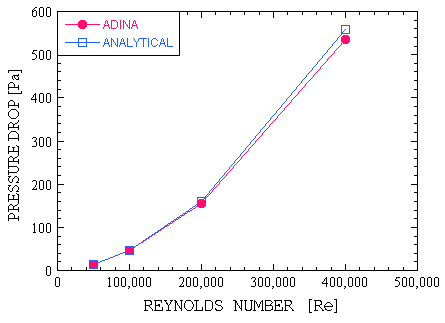
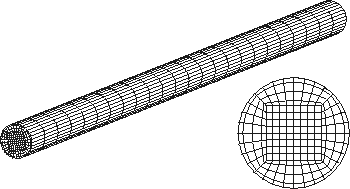
The pressure drop results from ADINA and the analytical/empirical solution are compared; please see the graph below. We see that the new FCBI elements are able to accurately predict the analytical/empirical results over a wide range of Reynolds numbers using the same relatively coarse mesh depicted under the graph.

pressuregraph

mesh_pipe


Relevant Tags

This blog is a part of the series Tunnel your way to success with PLAXIS. Introduction The Traditional Method of ...

Atkins is a multinational engineering, design, planning, project management, and consulting services company headquartered in London, UK. Part of the ...

How to Set Up the Fluidity Parameter γ of the Hoek-Brown Model with the Softening Model In the framework of ...

Subscribe to The Bentley Brief

Stay ahead of the curve with the latest infrastructure news and insights.