Home / Software Posts / Multiple Response Spectrum Curves With Different Damping Properties in STAAD

Multiple Response Spectrum Curves With Different Damping Properties in STAAD

Bentley Expert Profile Image

Bentley Expert

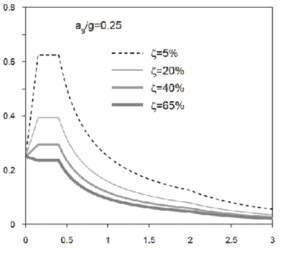
Graph depicting the relationship between a nondescript variable on the x-axis and another on the y-axis, with lines representing different levels of Damping Properties ranging from 5% to 65%.

Share

Each material has unique damping properties. If you want to analyze a structure composed of both steel and concrete you will have two different RS data with different damping properties for each material.Ā 

Multiple Response Spectrum Curves With Different Damping Properties in STAAD

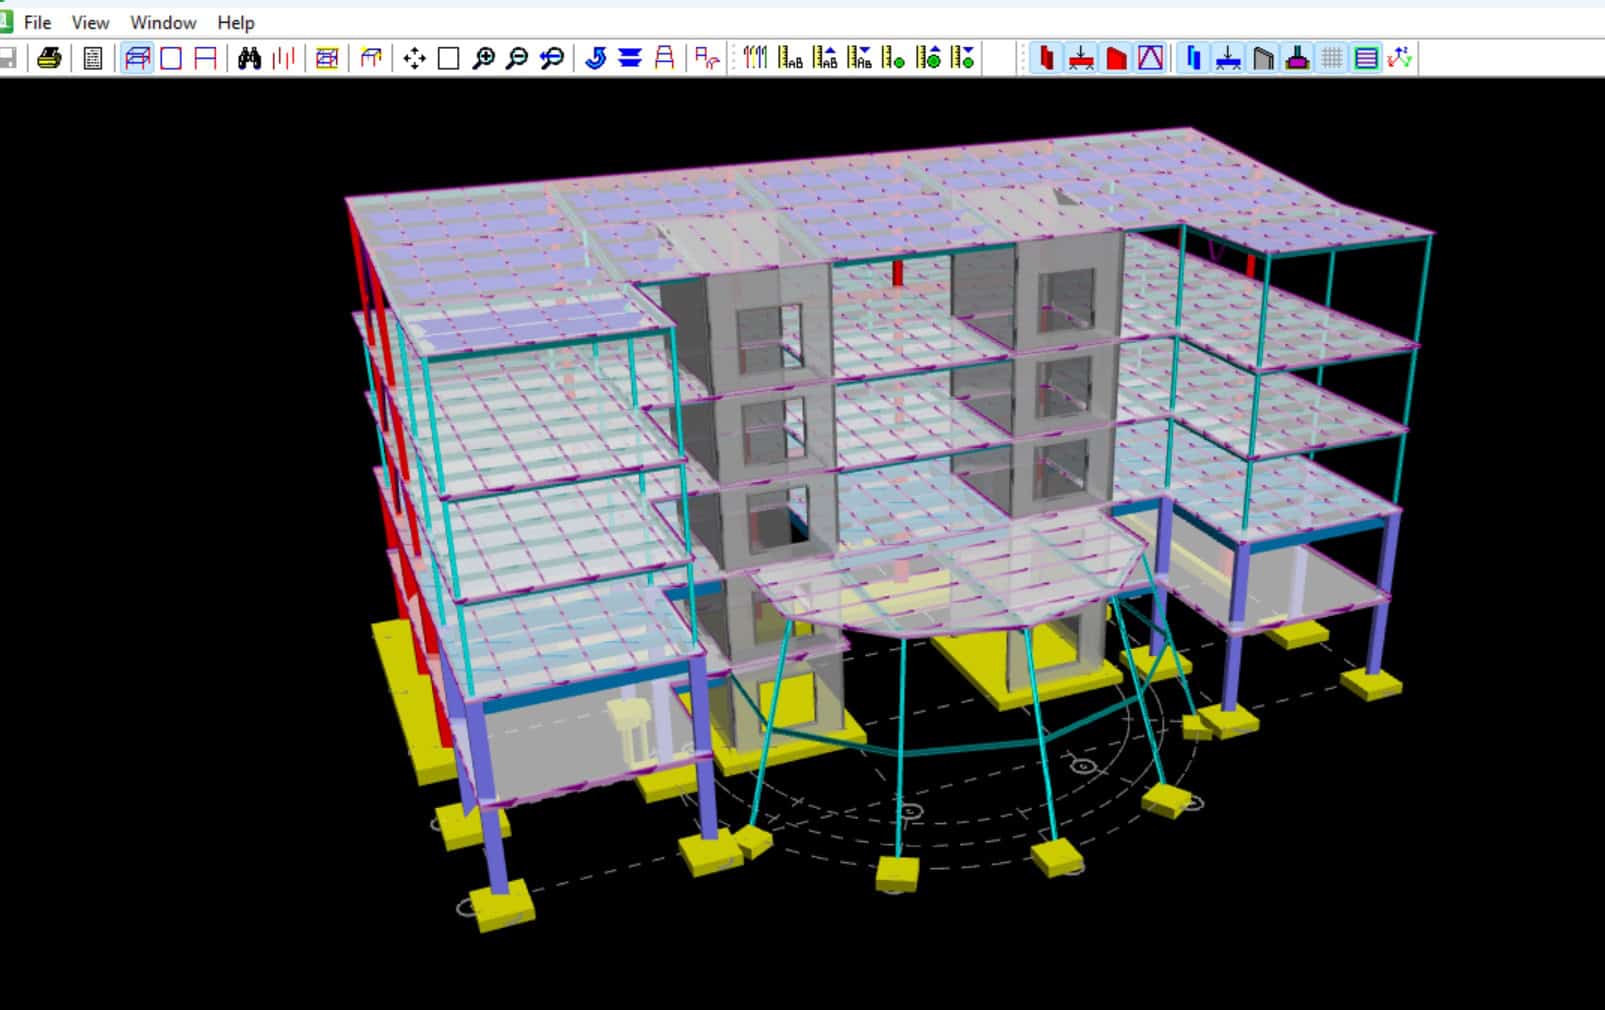
For example the first floor of a building is made of concrete and the floors above are made of steel. You can set different damping values for each material, but the RS curve to be used would only have a single damping value. To solve this you can define two different RS data pairs with unique damping properties for each material and assign them to their respective elements for analysis.

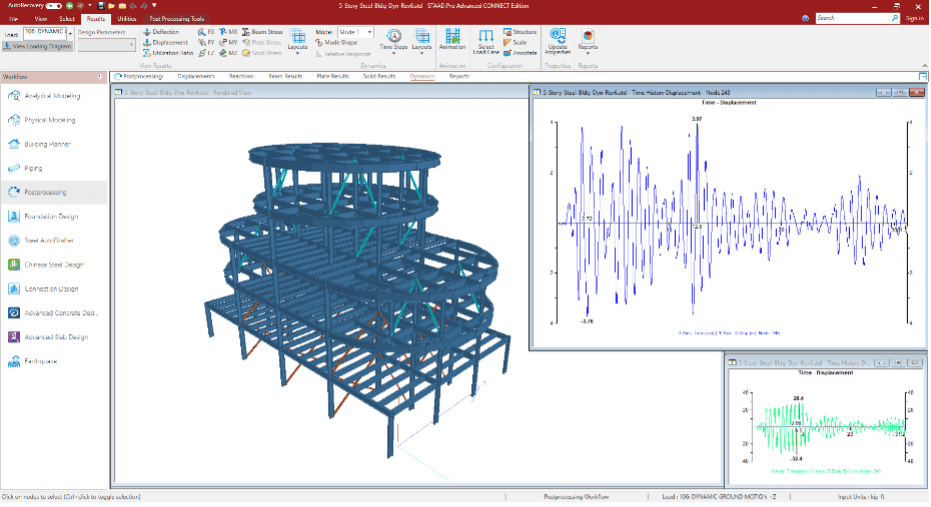
This video will walk you through the procedure to define multiple RS data sets with different damping properties and instruct the program to analyze a structure with multiple damping properties.

Related ArticlesĀ 

STAAD Learning Path

Relevant Tags

This content delves into the fascinating subject of pulsating moving loads on bridges, flyovers, and similar structures. Also known as ...

Every structure has its own unique natural frequency exhibited while disturbed by some external dynamic force. The external dynamic force ...

The most common type of retaining wall section is tapered with a stepped pattern. You can model the retaining wall ...