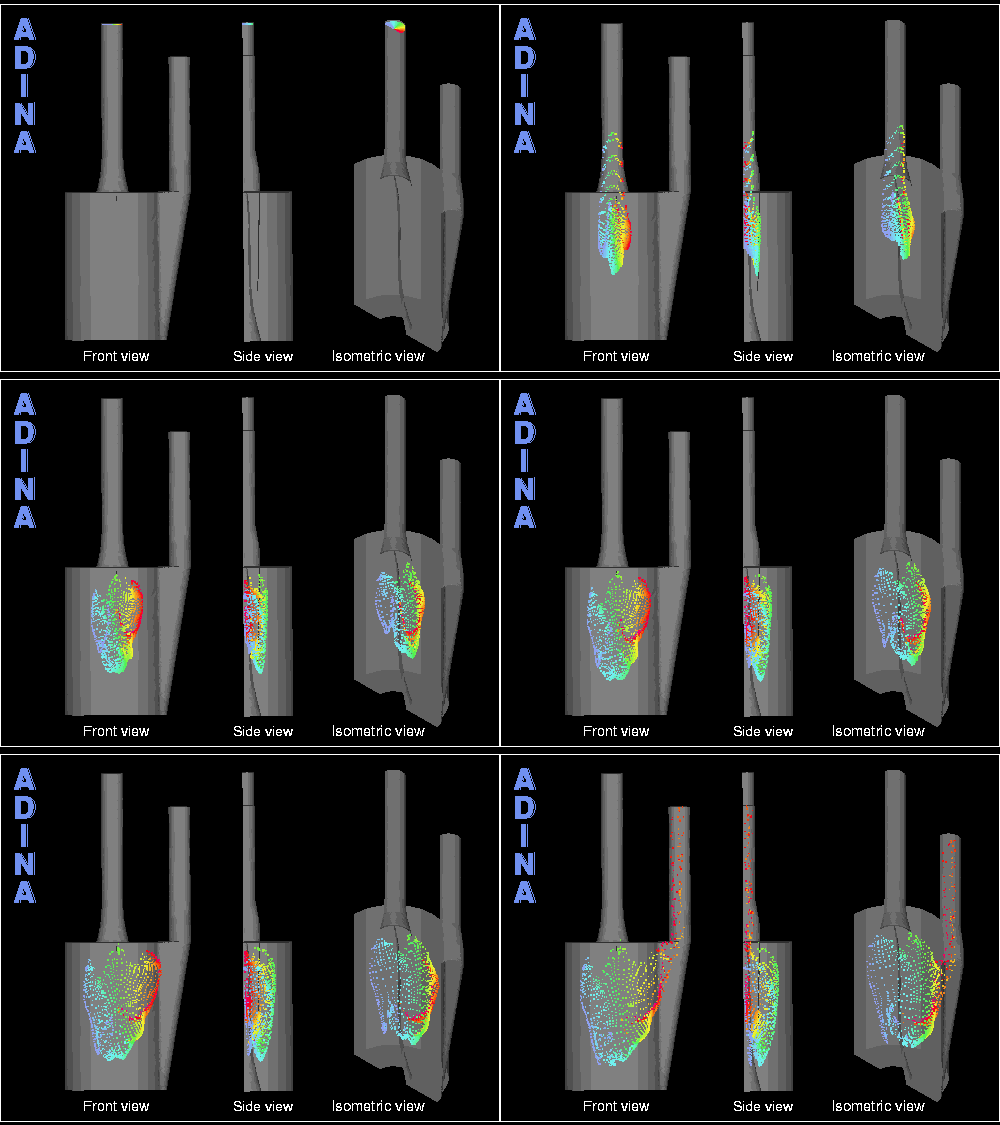
We present particle traces and additional results from the artificial lung analysis discussed in the ADINA System Newsletter of June 2002. Please refer to the Newsletter for additional information about the artificial lung analysis.
The animation shows how a bolus of particles injected at the fluid inlet of the artificial lung progresses into the lung, through the fiber bundle and out the fluid outlet. ADINA-F is used to compute the steady fluid flow through the artificial lung, and ADINA-PLOT is used to compute the particle traces and create the animation. Note that the particle colors are only used for easy identification of the particles and have no physical significance.
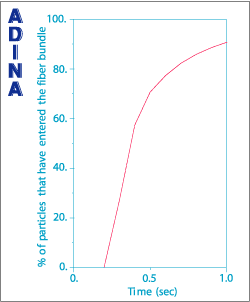
The figure at right shows the residence time distribution of the particles for the period of time shown in the animation. Initially all particles are in the lung, at the fluid inlet. At time 0.2, the first particles enter the fiber bundle. By time 1.0, about 90% of the particles have entered the fiber bundle. (Note that by time 1.0, some of the particles have exited the fiber bundle; this is not shown in the figure.)
This figure is easily obtained from the particle traces shown in the animation using a special ADINA-PLOT command.
