Shield tunneling using a large tunnel boring machine (TBM) is widely used to construct underground tunnels for subways. During tunneling, the soil strata substance is pressed, crushed, and removed by the TBM boring head. The shields, which are pushed along with the boring head, apply pressure on the newly created tunnel surface to stabilize it. After the boring head and the shields have advanced one lining width, a lining (pre-manufactured concrete ring segment) is installed. This procedure is often called a “launching” cycle in the industry. Thus, each launching will extend the tunnel by one lining width. A tunneling project can consist of thousands of launching cycles.
The tunneling process substantially changes the geological conditions causing the surrounding strata to sag or uplift, which can affect the stability of existing tunnels nearby. Therefore, it is important to have an accurate assessment of the effect of tunneling.
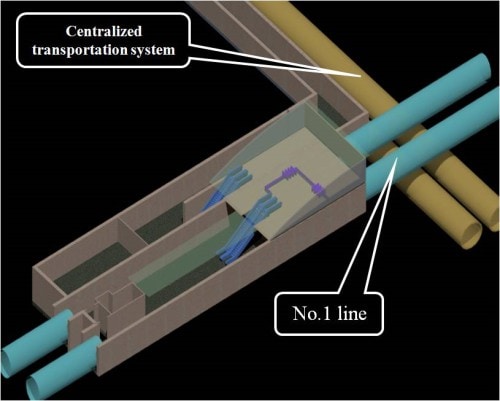
This blog post demonstrates how engineers and scientists of Zhongshan University (See the reference at the end of this blog post) applied ADINA software to evaluate the effect that the shield tunneling of the Guangzhou Zhujiang Xincheng underground automatic passenger mover (APM) system would have on the existing Guangzhou subway Line 1 tunnels. The APM tunnels are 17.4 meters below ground level, and cross the Line 1 tunnels 2.4 meters under them (see Figure 1). ADINA was chosen because of its many powerful capabilities, particularly its accuracy in handling complex nonlinear problems.
Figure 1: Line 1 tunnels and the tunnels for the APM centralized transportation system
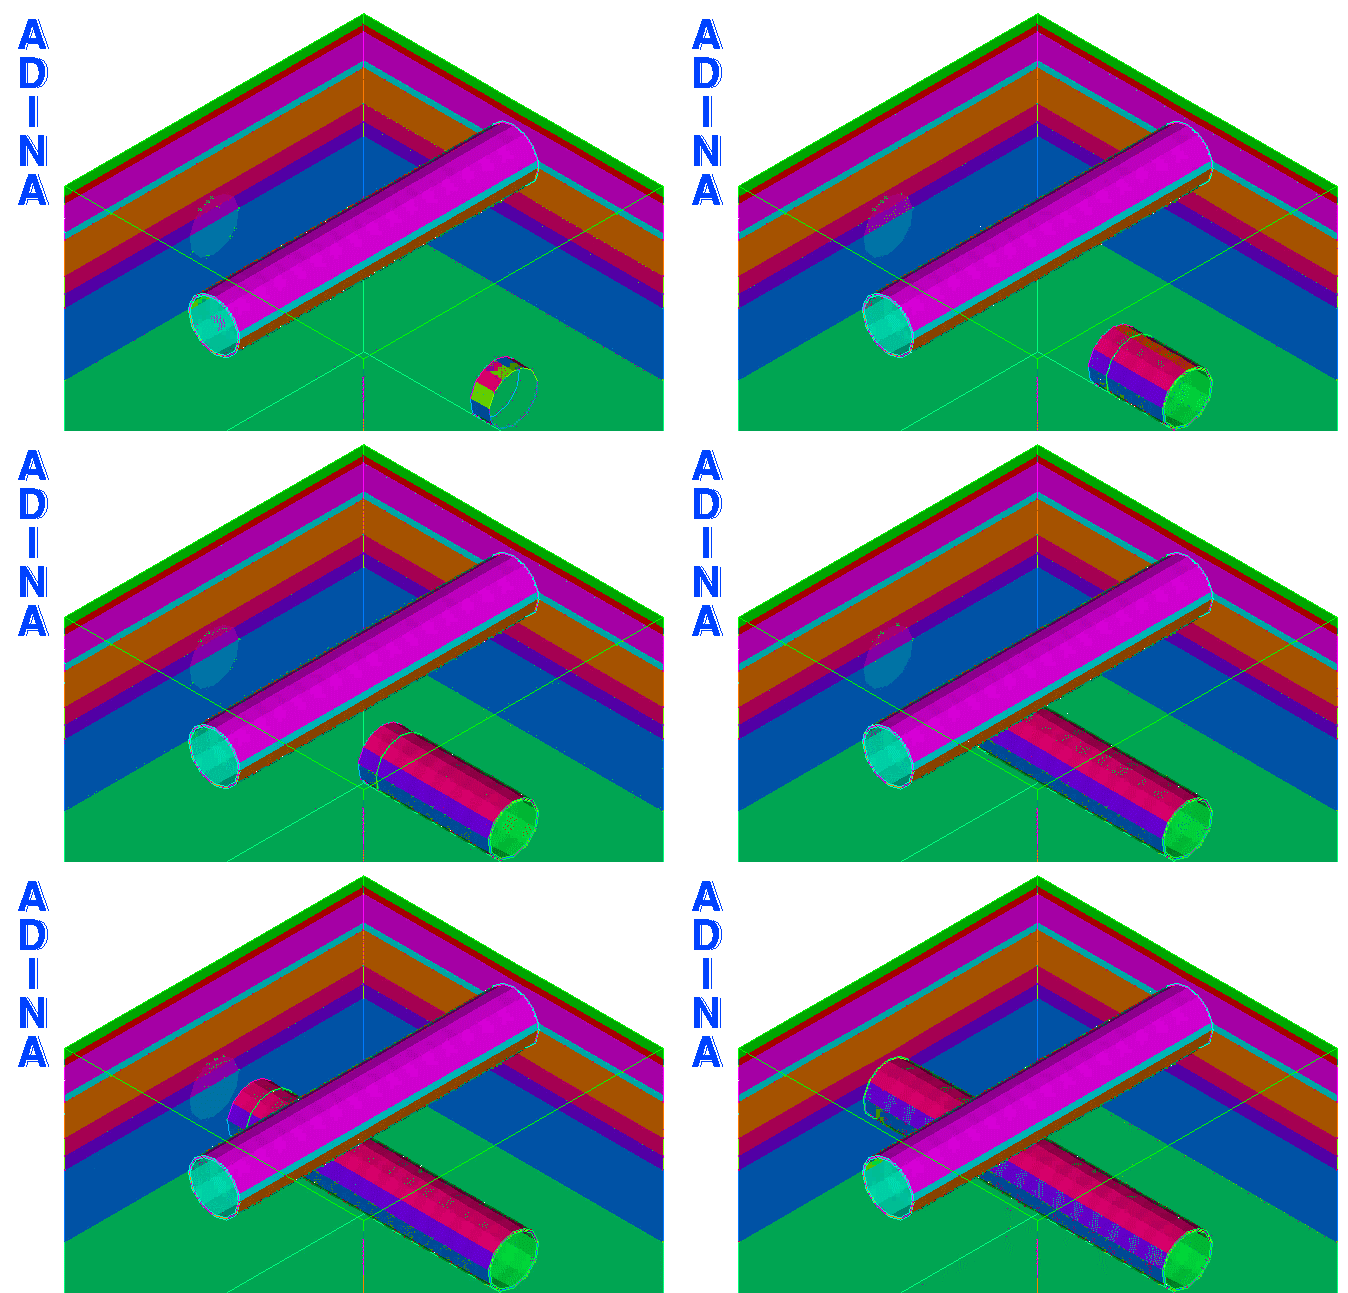
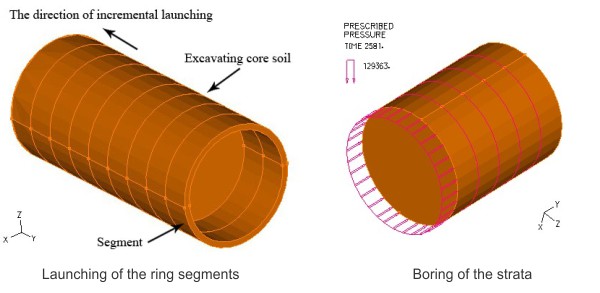
Figure 2 shows a detail of the ADINA finite element model of the tunnels. Element death and birth are used to simulate the tunneling procedure — in each launching, the strata elements surrounded by a ring segment “die” and the ring segment elements are “born” (see Figure 2). Each launching takes 43 minutes, and in total, 155 launchings are simulated to achieve the required accuracy.
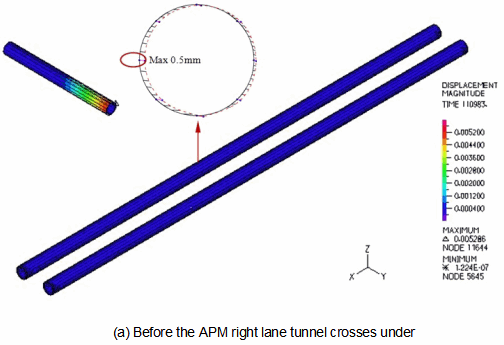
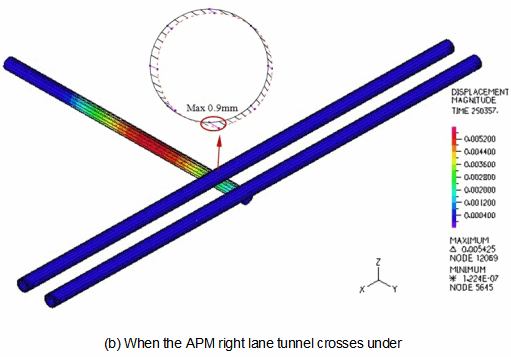
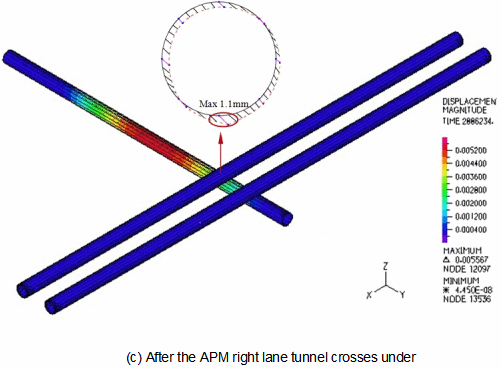
The movie above illustrates part of the tunneling. Figure 3 shows the movement of the Line 1 tunnels during the APM tunneling procedure. As one can see, the predicted movement was very small (only ~1 millimeter).
Figure 3: Movement of the Line 1 tunnels during the APM tunneling
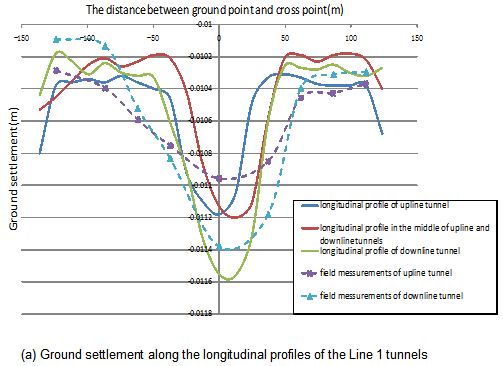
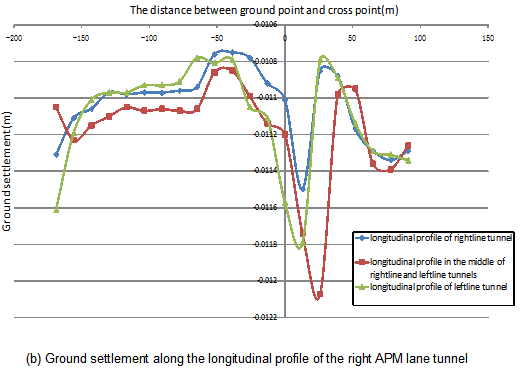
The curves in Figure 4 depict the ground settlement in the region close to where the existing Line 1 tunnels and the new APM tunnels cross. The longitudinal profiles (solid curves) were calculated from the ADINA model, with the actual field measurements of the ground settlement (dashed curves) plotted for comparison. As clearly shown, the predicted settlement was only about 10 millimeters and the simulation results matched the measurements reasonably well.
Figure 4: Ground settlement curves
Based on the simulation results, the engineers predicted that the tunnel movement and the ground settlement due to the tunneling would be small and well within the design tolerance, hence the stability of the tunnels would not be affected.
The reliability and accuracy of ADINA make it the preferred engineering simulation software in a wide range of industries.
Reference
- Z. Liu, C. Zhou, and F. You, “3D Numerical Stability Analysis of Overlapped Tunnel Groups under Shield Tunnel Undercrossing,” International Journal of Earth Science and Engineering, Vol. 5, No. 5, pp. 1110-1122, October 2012.
Keywords:
Soil mechanics, tunneling, launching cycle, liner, nonlinear, birth-death option
