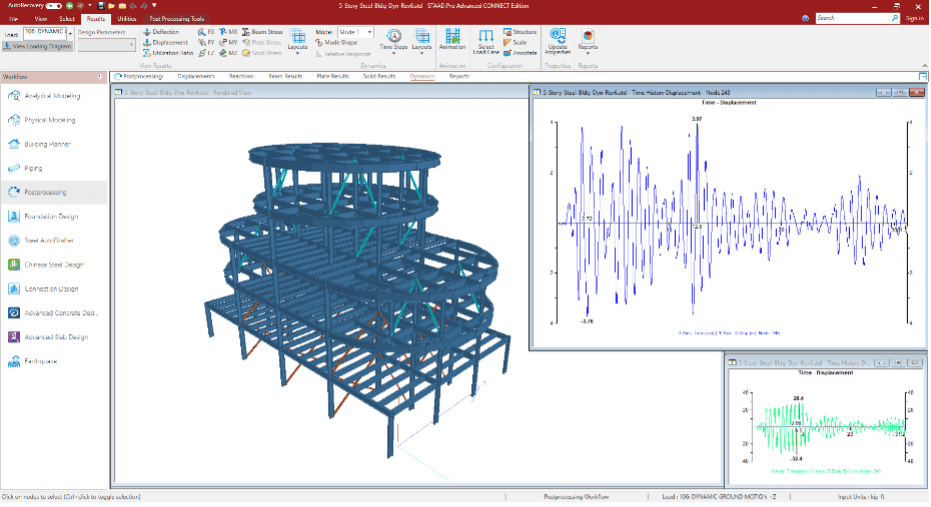
In spectrum compatible time history, we will see how to generate Synthetic time history for an existing Response spectrum graph.
Certain important industries like Nuclear Process Plants and Public Utility Industries need rigorous analysis against the seismic activities to ensure its structural integrity and safety. However, generating the time history from the actual earthquake data has many limitations. Hence, the artificial set of time history data generated from the response spectrum is widely used.
The initial set of time history is generated using the concept of the Fourier series coefficient. Then, the corresponding response spectrum data is generated. The RS data is compared with the design response spectrum data, if they are not comparable then the values are iterated. This process is known as Spectrum matching.
Synthetic time history from Response spectrum
Procedure
- Firstly, under the time history definition dialog box, choose the spectrum option. This spectrum option is to generate the Synthetic time history from our existing Response spectrum.
- Secondly, under the “Define Time history” dialog box, define the three different time points to control the shape of the target response spectrum
- Next, add the number of iteration and number of digitized frequency option
- After analyzing, check the output file to get the time vs acceleration output that STAAD.Pro generates to convert the Response spectrum to time history data.
- Finally, this time vs acceleration data, when taken to an Excel sheet, generates the time history graph.
Video demonstration of Spectrum compatible time history in STAAD.Pro
Spectrum compatible time history in STAAD.Pro


