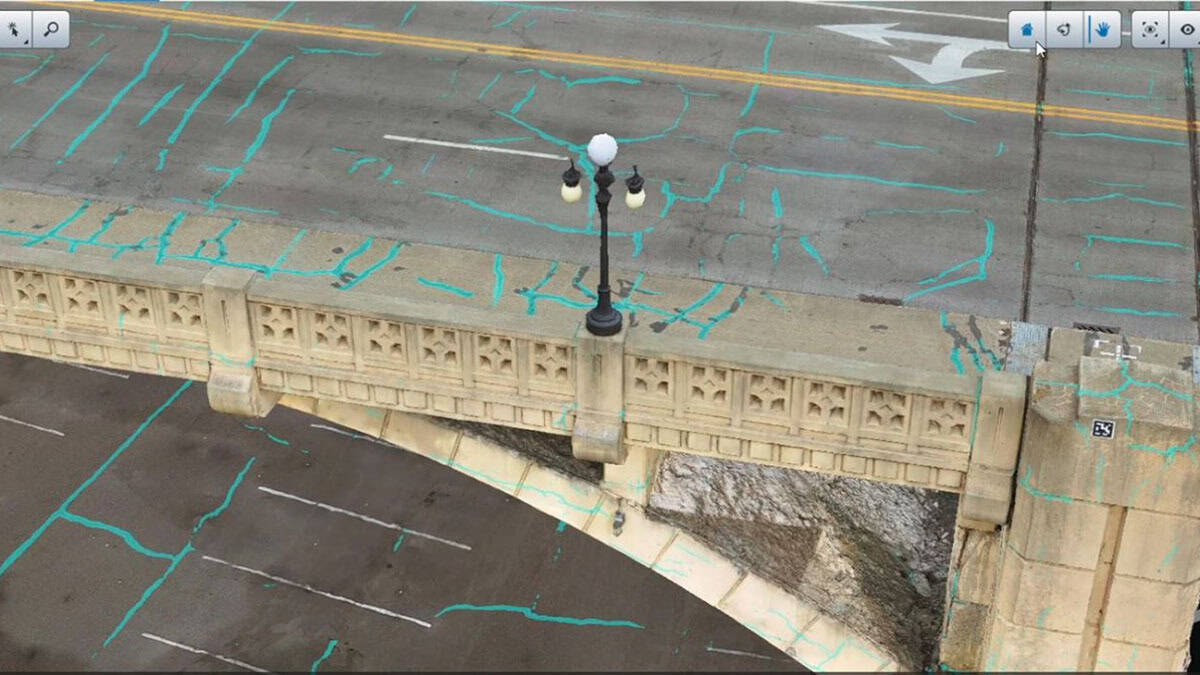
Our critical infrastructure, like the bridges that we cross, the railways that move goods, and the dams that protect our cities, is constantly aging. For decades, weāve relied on a simple āwait for the alarmā approach to maintenance. But what if we could see problems developing weeks or even months before the alarm ever sounds?

This shift from reactive to predictive is no longer science fiction; itās the reality being built today with AI-powered analytics. To help us understand what this means for the future of infrastructure, we sat down with Vahid Abdollahi, applied AI scientist at Bentley Systems. He walks us through how AI-powered analytics give engineers the infrastructure insights that they need to predict and prevent failures before they happen.
Question: Let’s start with the big picture. Why is it so important to move from just āreacting to alarmsā to āpredicting problemsā with our infrastructure?
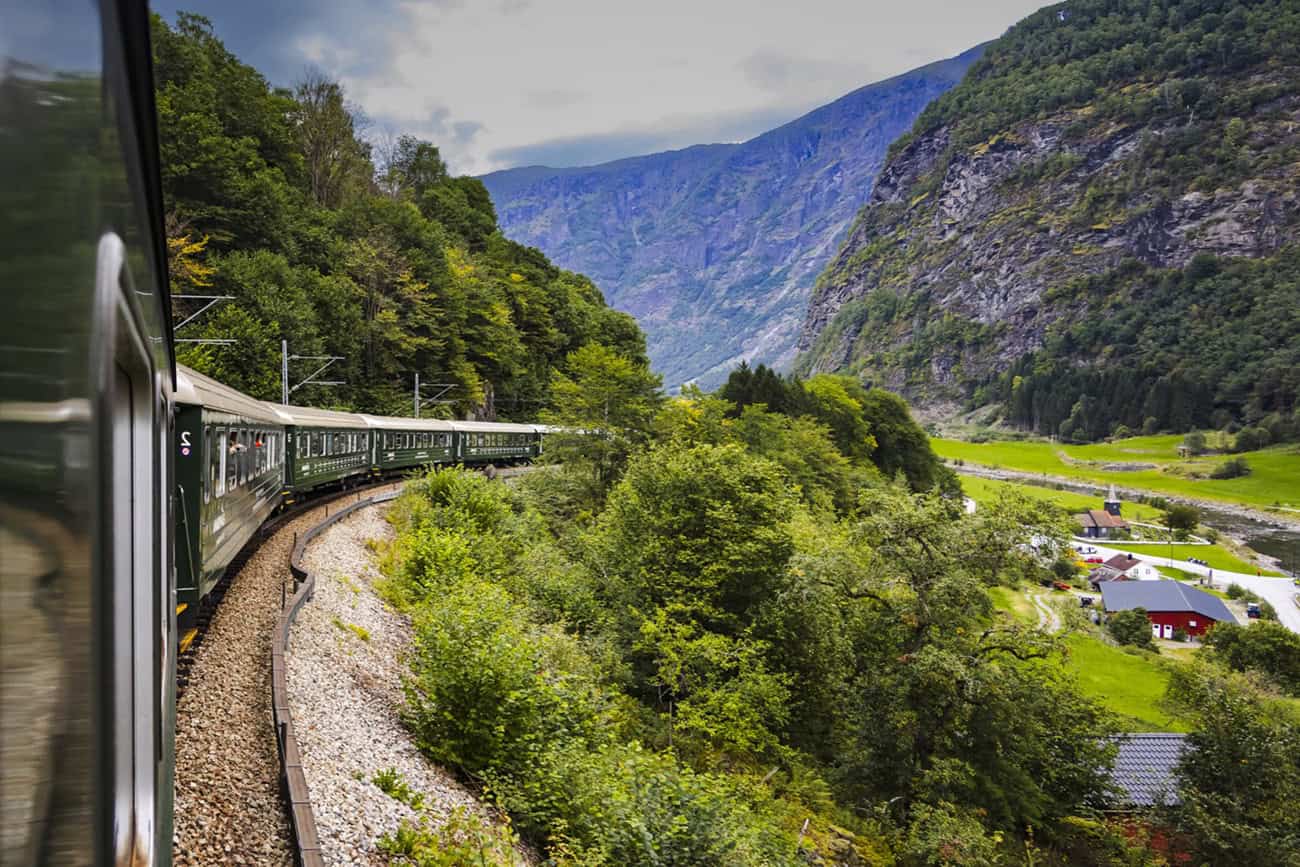
Vahid: The answer really comes down to safety and time. Imagine an old railway embankment. Reacting to an alarm might give you a two-day warning before a potential failure. Thatās a scramble. But predicting the problem six weeks in advance? Thatās the difference between an emergency shutdown and a planned, controlled maintenance operation. Itās about turning a potential catastrophe into a manageable task. We want to give operators weeks of lead time, not hours.
Question: So, if an organization wants to start using AI to predict these issues,where do they begin? Is it all about complex algorithms, or does it start with sensor data quality?
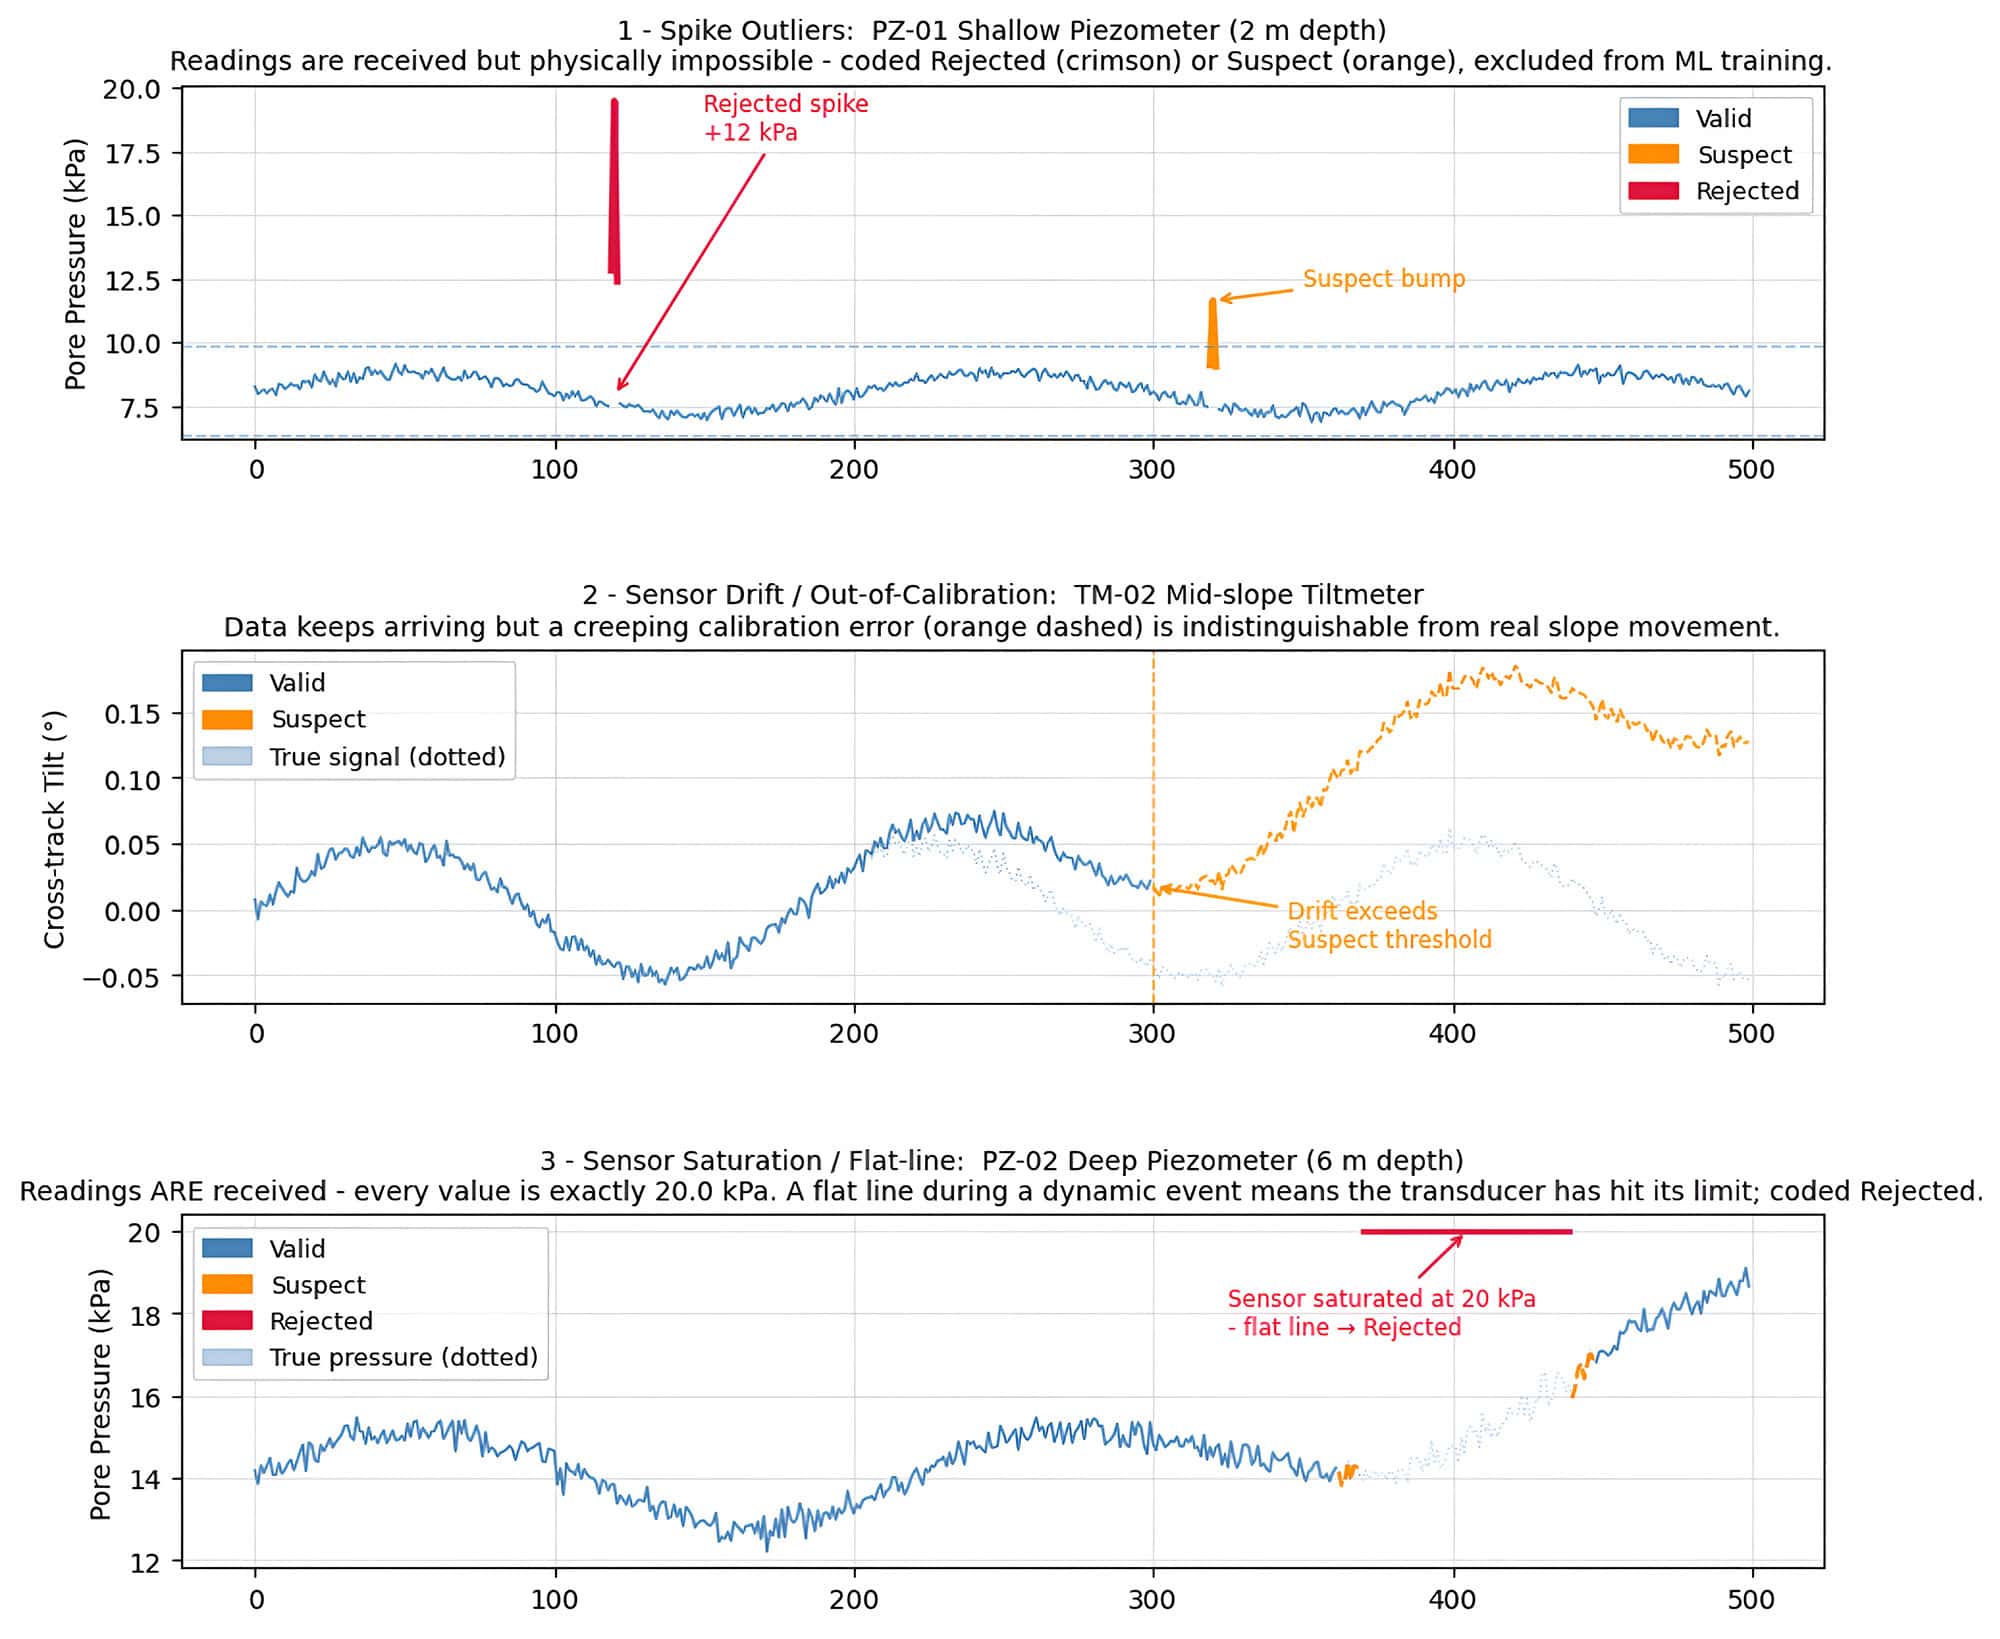
Vahid: Not at all. The single most important thing is sensor data quality. AI models are only as reliable as the data they learn from. Bad data doesn’t just give you bad predictions, it teaches the model bad patterns that it will confidently apply in the future, which is far more dangerous. In the real world, sensors can fail, drift out of calibration, or get affected by weather. So, the first step is always a rigorous data quality check. We have to teach the system what is a āvalidā reading, what is āsuspect,ā and what is just plain wrong. It’s about deciding what lessons you allow your AI to learn.
Question: Once the data is clean, what happens when you have different sensors reporting at different speeds? For example, a rain gauge reporting every 15 minutes but a ground movement sensor reporting only once a day?
Vahid: Thatās a very common challenge. To see how rainfall affects ground movement, all the data needs to be on a shared timeline. We use techniques called āresampling.ā We might average the fast-reporting sensorās data into hourly or daily windows, or we might intelligently āfill in the gapsā for the slower sensor. The key is that weāre not losing information; we are choosing the right analytical lens for the question at hand. The goal is to line everything up so we can accurately see cause and effect.
Distinguishing structural problems from sensor noise
Question: Getting the data foundation right seems like the critical first step. Once that is in place, a major challenge must be distinguishing a real structural problem from normal background noise, like gradual drift or seasonal changes. How do you teach the AI to know what to ignore?
Vahid: That is the single biggest source of “alarm fatigue” in monitoring. To solve it, we apply a few layers of defense. First, we check against the laws of physics. For example, water pressure in dense clay simply cannot rise by a huge amount in 15 minutes. If a sensor reports that, the AI flags it as a sensor fault, not a physical event.
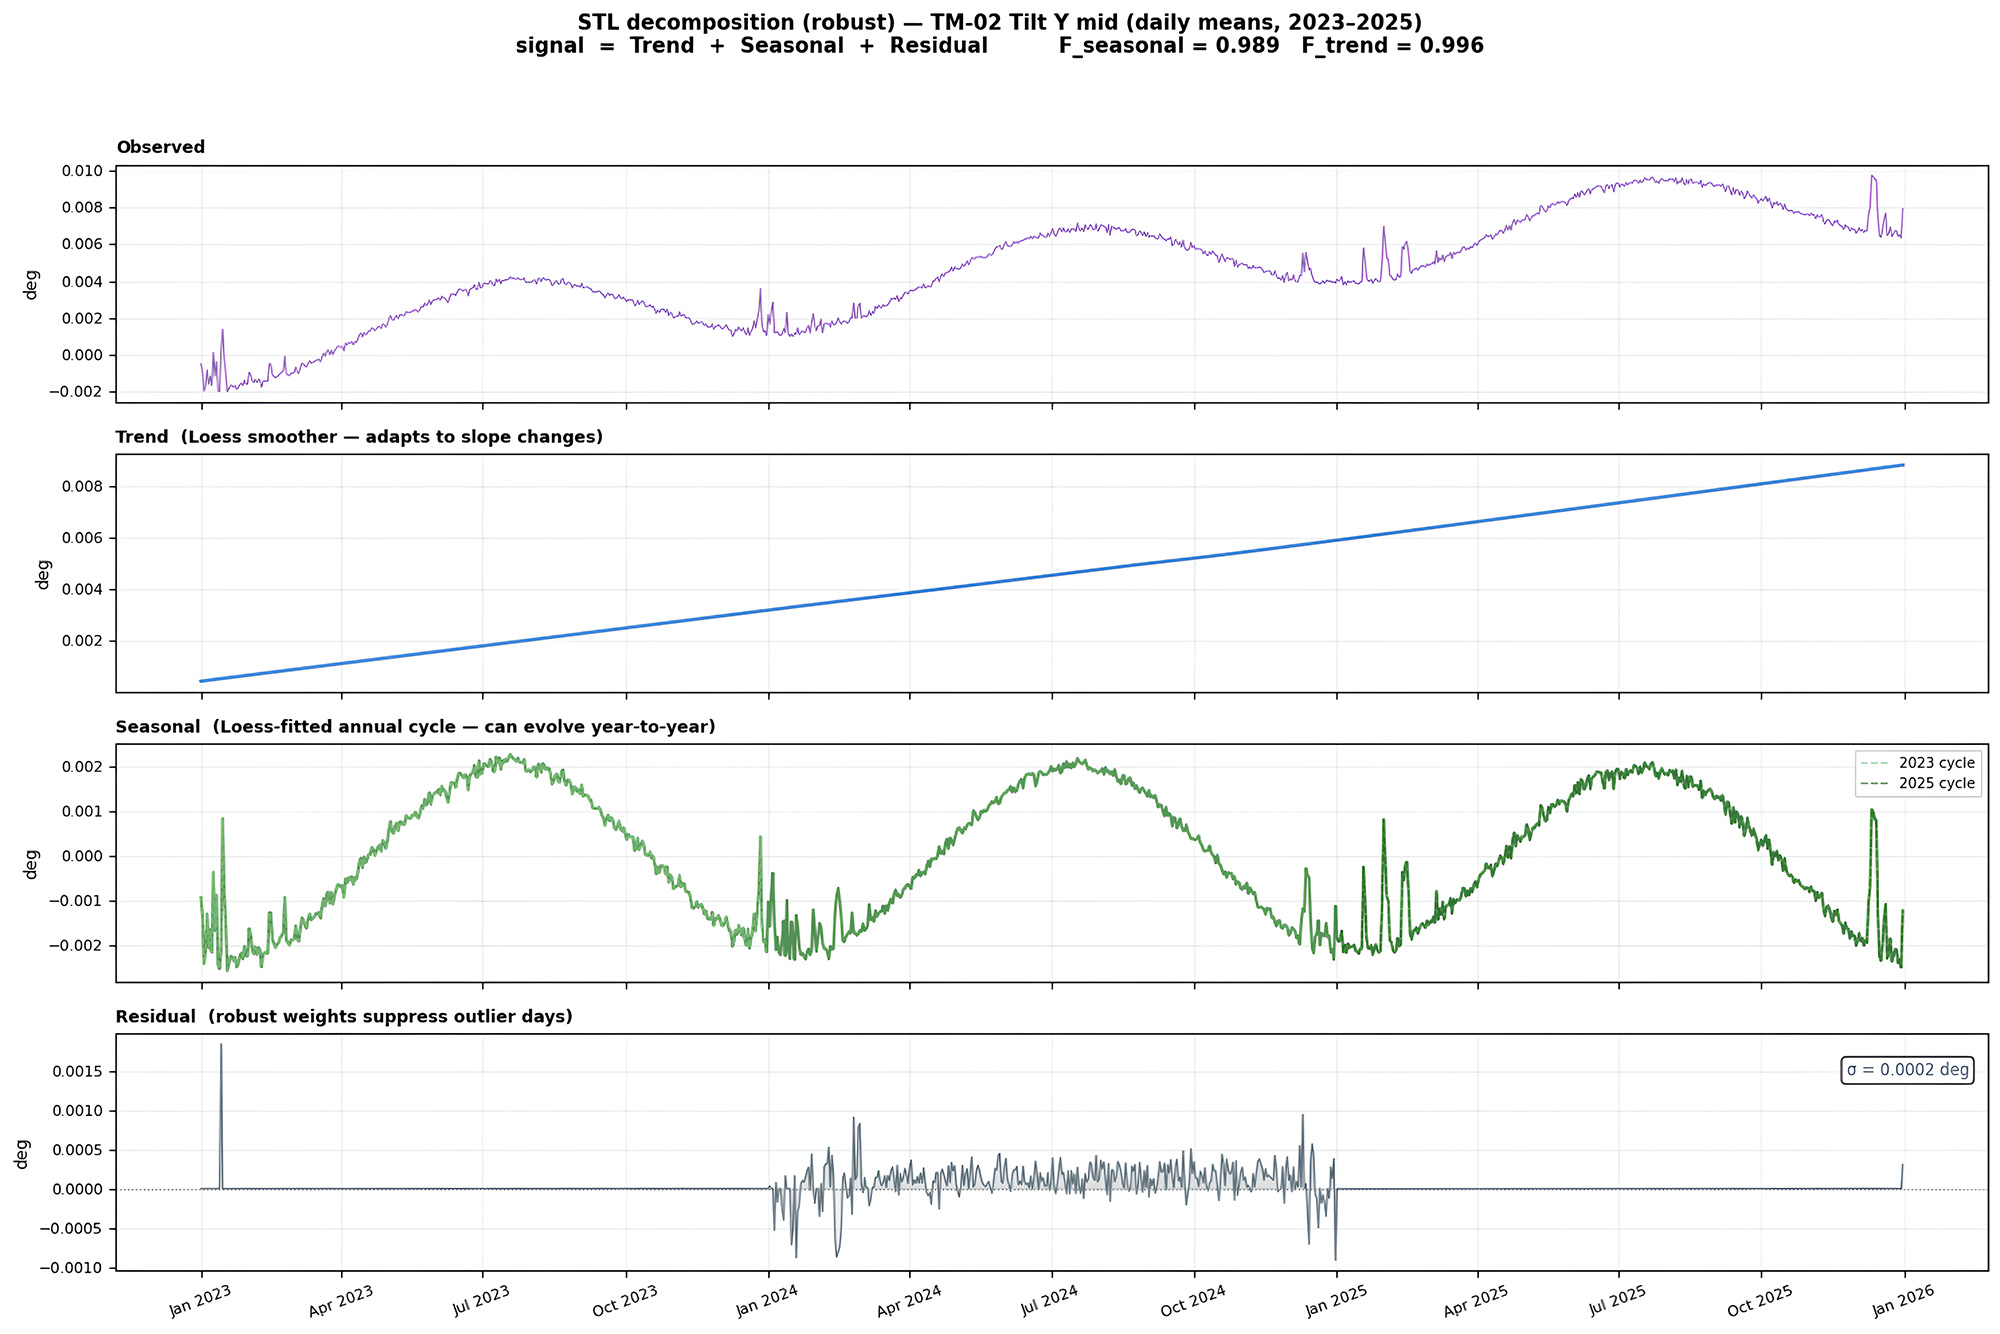
For the trickier environmental changes, like a bridge naturally expanding in the summer heat, we mathematically decompose the sensorās signal. We separate the raw data into three parts: the long-term trend (gradual drift), the repeating seasonal pattern, and the residual, or what is left over. The residual represents behavior that cannot be explained by normal seasonal changes or baseline drift. A growing residual is a highly sensitive, specific early warning of genuine structural distress, because all the expected, normal behavior has already been filtered out.
Question: Once you have that āunexplainedā residual signal, how do you pinpoint the exact moment a new problem starts?
Vahid: For that, we use changepoint detection. A changepoint is a definitive, permanent shift in the sensor’s behavior, representing a change in its trend or average. This could signal a new crack, an acceleration in creep, or a change in soil conditions. We apply algorithms that are designed to find these changepoints in the residual signal. This allows us to identify the precise moment a new, underlying physical change begins, long before it would ever cross a simple, fixed alarm threshold.
Question: So the system can flag that something is happening. But can it tell you what is happening? For example, can it distinguish between a sensor malfunction and the early stages of a real failure?
Vahid: Absolutely, and this is where it gets really powerful. First, we look at the “fingerprint” of the event. A sensor fault typically affects only that one sensor, while all its physically connected neighbors remain normal. A real event, like storm infiltration, causes a cascade of responses across multiple sensors, like pressure, moisture, and tilt, in a predictable sequence. Machine learning (ML) classifiers can be trained on these fingerprints to distinguish a āsensor faultā event from a ārain-induced creepā event. It moves the system from anomaly detection to automated diagnosis for infrastructure monitoring.
Question: You mentioned cause and effect earlier. How does AI help you connect the dots between different sensors, like rainfall and ground pressure?
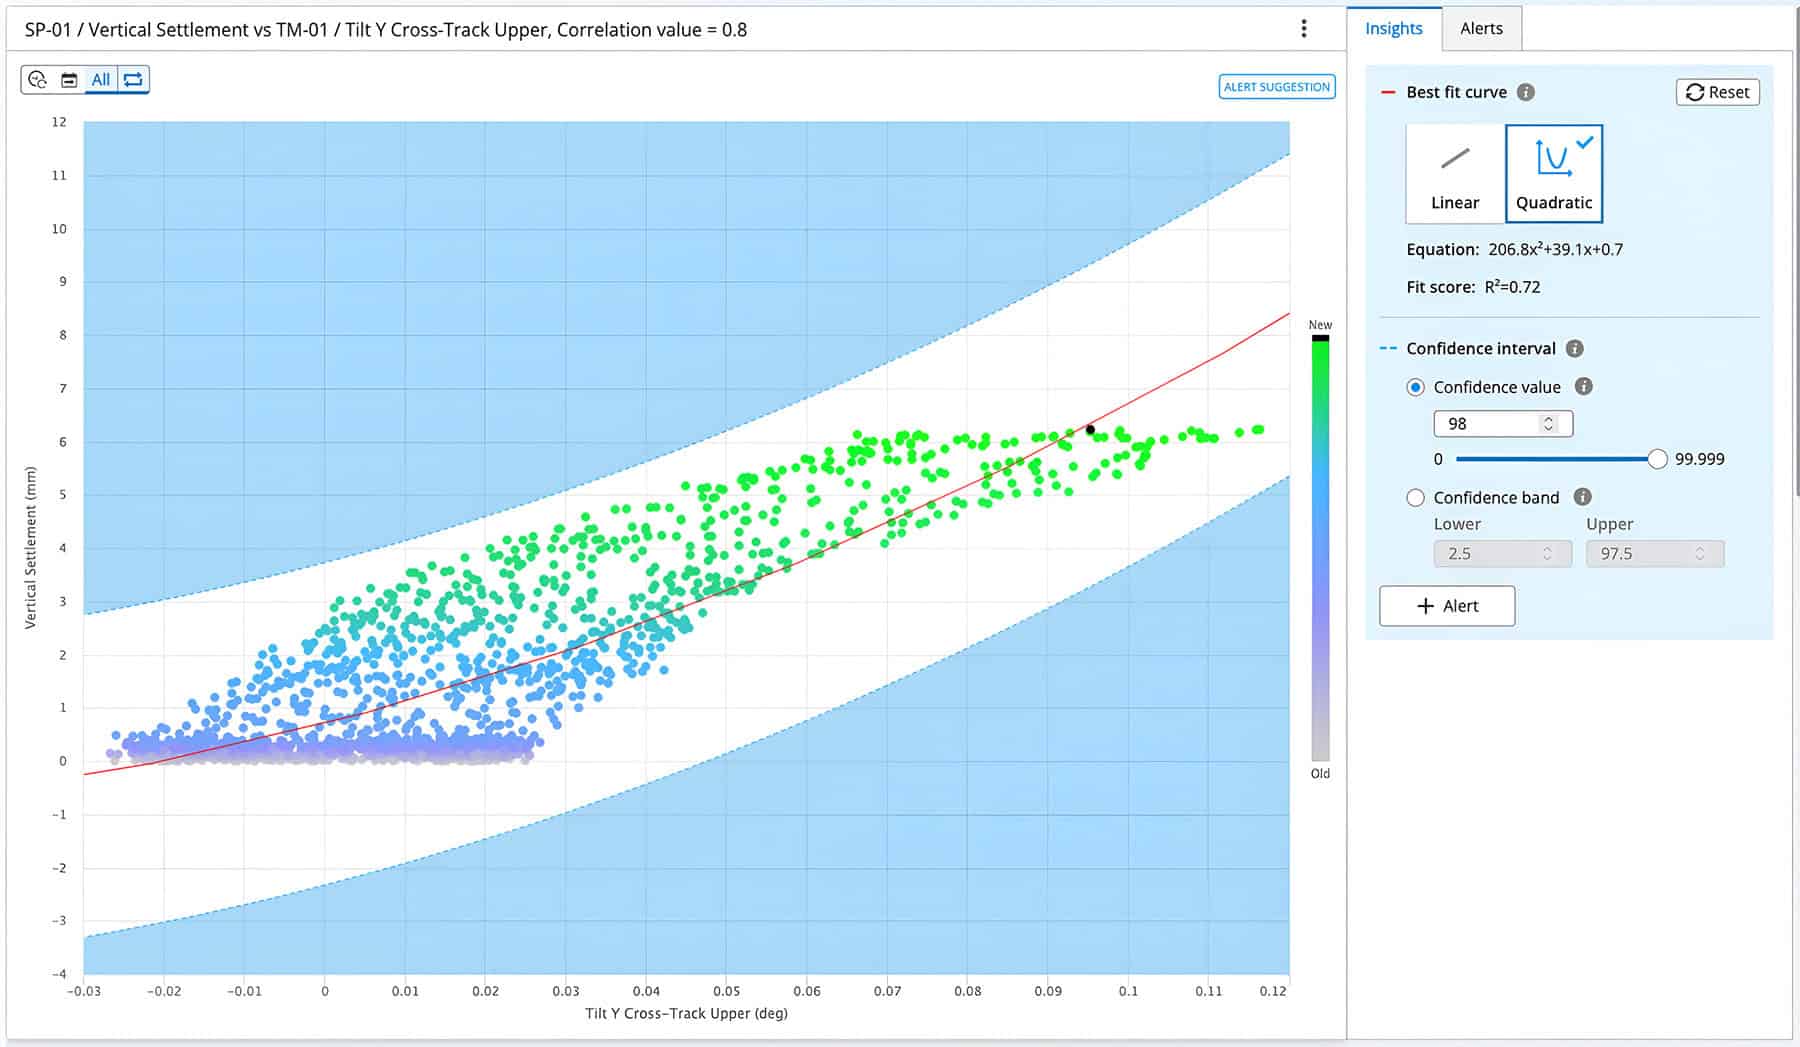
Vahid: This is where we move into the exciting part of AI-powered predictive analytics. We use something called ācross-correlation.ā It doesn’t just ask, ādo these two things move together?ā but rather, ādo they move together if I shift one of them in time?ā For our railway embankment, rain doesn’t instantly cause pressure to build deep in the ground; it takes time for the water to seep down. Cross-correlation measures that exact time lag.
Crucially, for a healthy embankment, this lag should remain stable. If we see that lag time getting shorter after every storm, it tells us water is moving through the ground faster than it should be. This could be a sign of internal erosion, which is a serious problem, long before any significant movement is detected.
Question: So, you’re not just looking at one sensor, but at the relationship between them. How does that help you build a true early-warning system?
Vahid: Exactly. An early-warning system has to understand the whole causal chain. A single model watching only a tilt sensor on a slope is sitting at the end of the chain. By the time it detects acceleration, the failure is already well underway. A āmultivariateā model, on the other hand, learns the relationships between all the sensors simultaneously. It understands that a certain amount of rainfall, followed by a specific rise in moisture and deep-ground pressure, is a predictor of dangerous tilt. It sees the drivers, not just the final effect. Using this approach, we can predict dangerous conditions 4 to 6 weeks in advance.
Keeping engineers in control of AI insights
Question: The idea that AI can understand complex physics to give weeks of advance warning is a gamechanger. But for many, AI can feel like a “black box.” If an AI model flags a risk, how do you get around that trust problem?
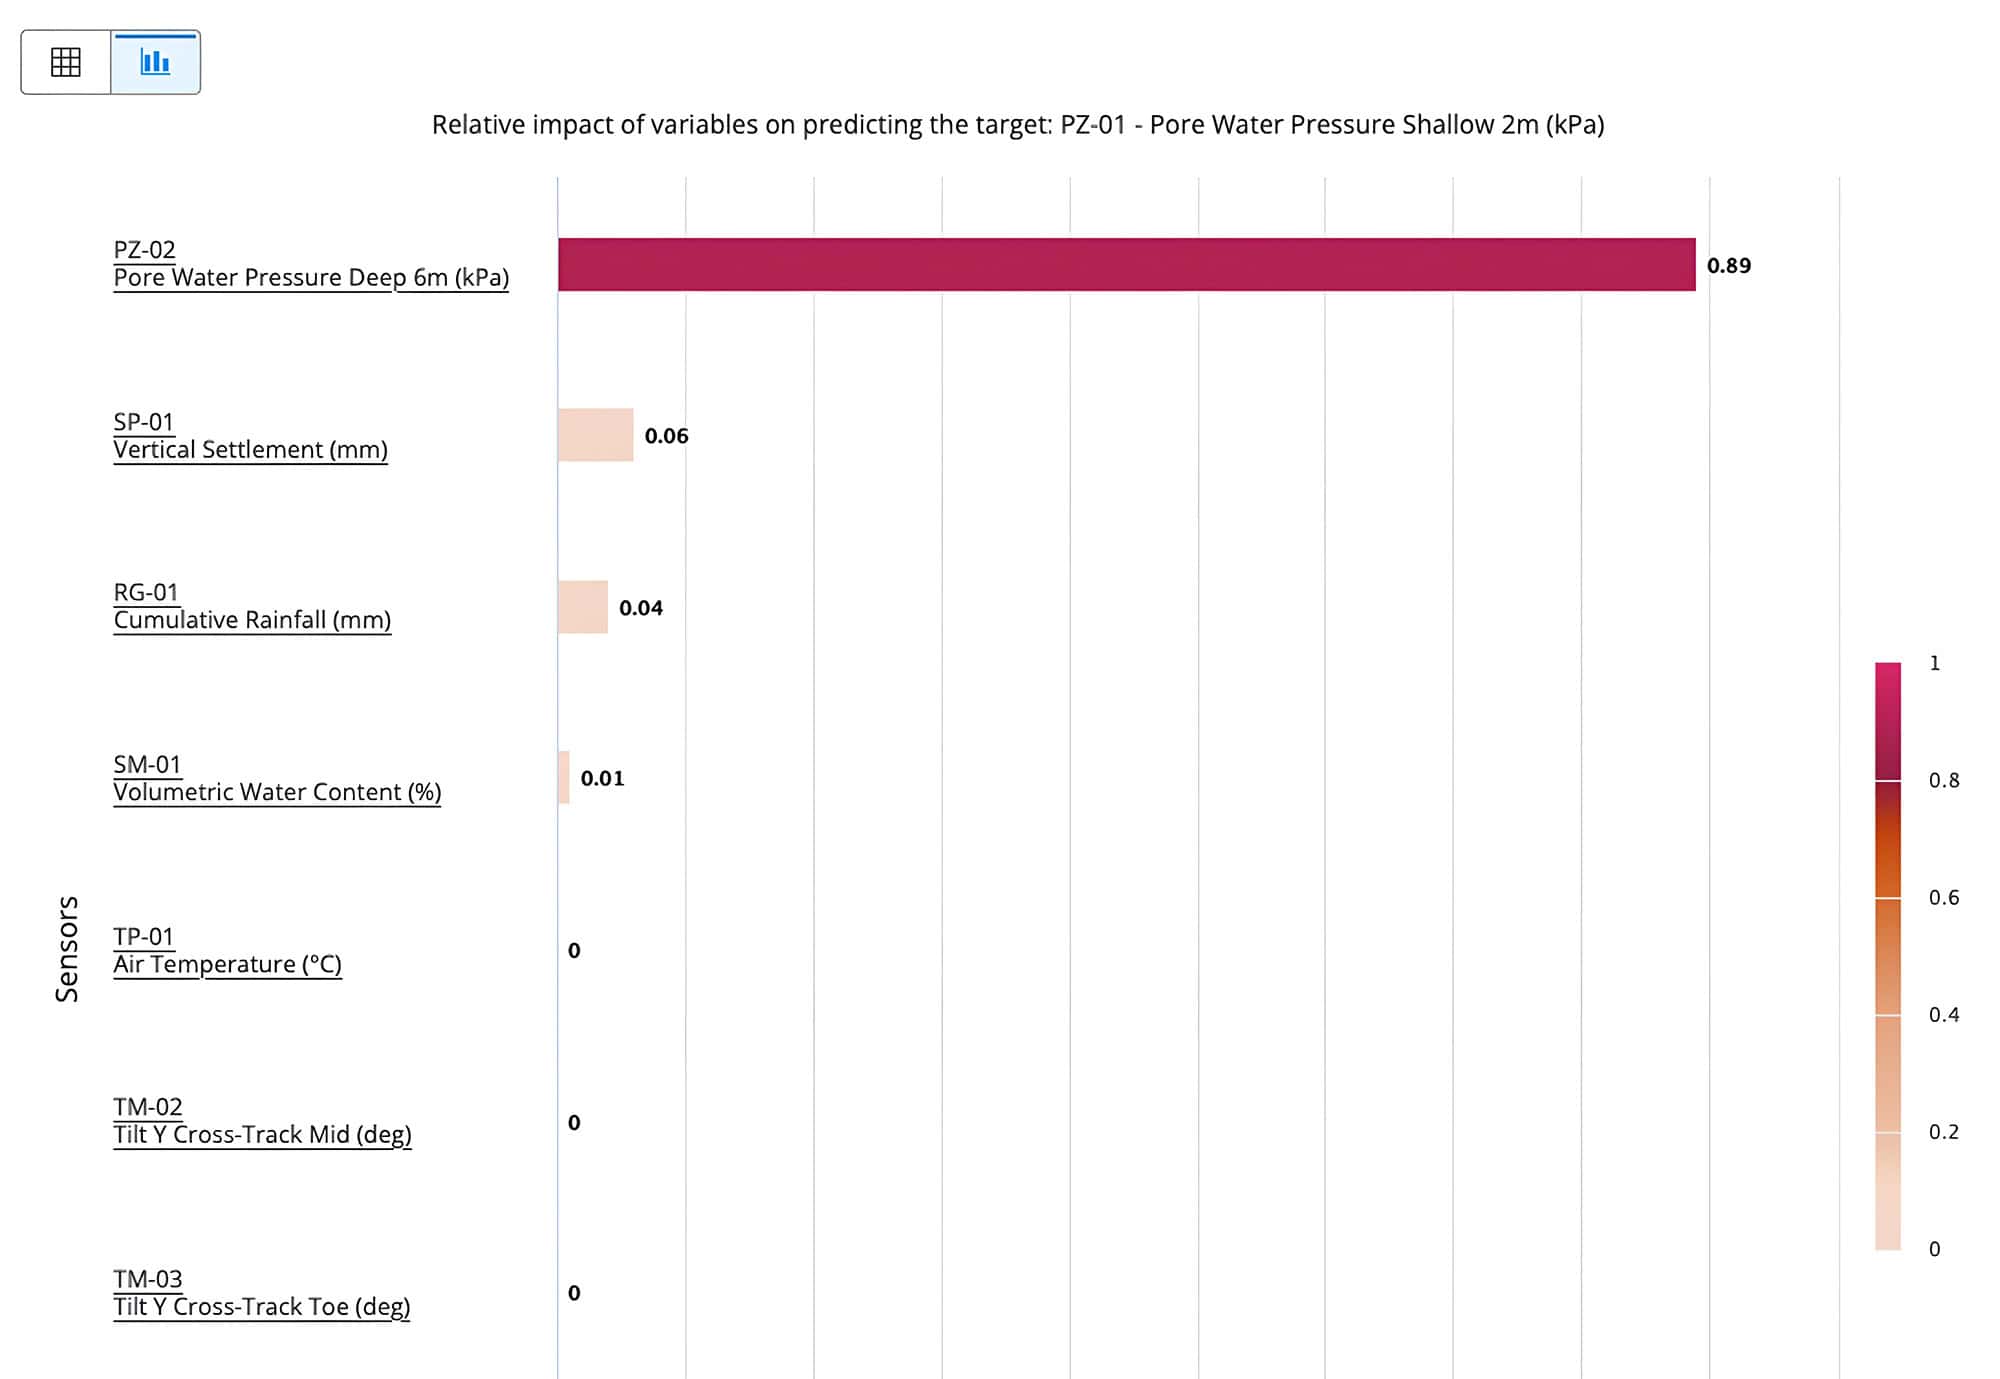
Vahid: This is one of the most important questions, because engineers are legally and ethically responsible for their decisions. They cannot simply say, āthe computer told me so.ā We bridge this gap with āfeature importanceā analysis. After a model makes a prediction, we can essentially ask it, āWhat were the most important factors in your decision?ā The model then provides a ranked list. In our embankment example, it will likely show that ādeep pore pressureā and ārecent rainfallā were the dominant factors, which is exactly what geotechnical science would predict. This makes the AIās reasoning transparent, defensible, and based on sound physical principles.
Question: So, the ML models are handling the prediction side. But how does all of that actually get communicated as actionable insights to the engineer who has to make a decision at 7 a.m.?
Vahid: Thatās exactly where generative AI comes in. Everything weāve discussed so far produces numbers and charts, but engineering decisions require narrative and context. Think of a monitoring engineer starting their day. Instead of looking at a dashboard of 50 blinking red lights, generative AI can synthesize all the overnight data and provide a prioritized summary in plain English.
For example, it might say, āThe pressure spike in sensor P-105 at 3 a.m. coincided with a scheduled drainage cleaning operation. This is likely a false alarm. However, the slow, steady creep in the north embankment continues, and the system recommends a visual inspection this week.ā It turns an overwhelming amount of data into actionable intelligence.
Question: So, it sounds like the goal is to augment the engineer, not replace them?
Vahid: Precisely. The vision is for quantitative ML models to provide predictive intelligence, as well as for generative AI to provide the narrative bridge between those predictions and engineering action. It frees up engineers from routine data-checking so they can focus on what they do best: making critical decisions to ensure the safety and reliability of our infrastructure.
Turning predictive analytics into engineering action
As the demands on our global infrastructure continue to grow, the shift from reactive monitoring to proactive, predictive intelligence is no longer just an option; itās a necessity.
Bentleyās iTwin IoT is making this shift a reality. By integrating predictive analytics features with a rock-solid data foundation, iTwin IoT helps engineering teams break free from data overload and alarm fatigue. It empowers operators to move beyond simply reacting to raw sensor data, allowing them to extract the precise, actionable insights needed to anticipate issues and ensure the safety, longevity, and resilience of critical assets.
Ready to transform how you manage and monitor your infrastructure? To learn more about iTwin IoT, visit the iTwin IoT page, or contact us today to see how we can put these AI-powered infrastructure insights to work for your specific projects.