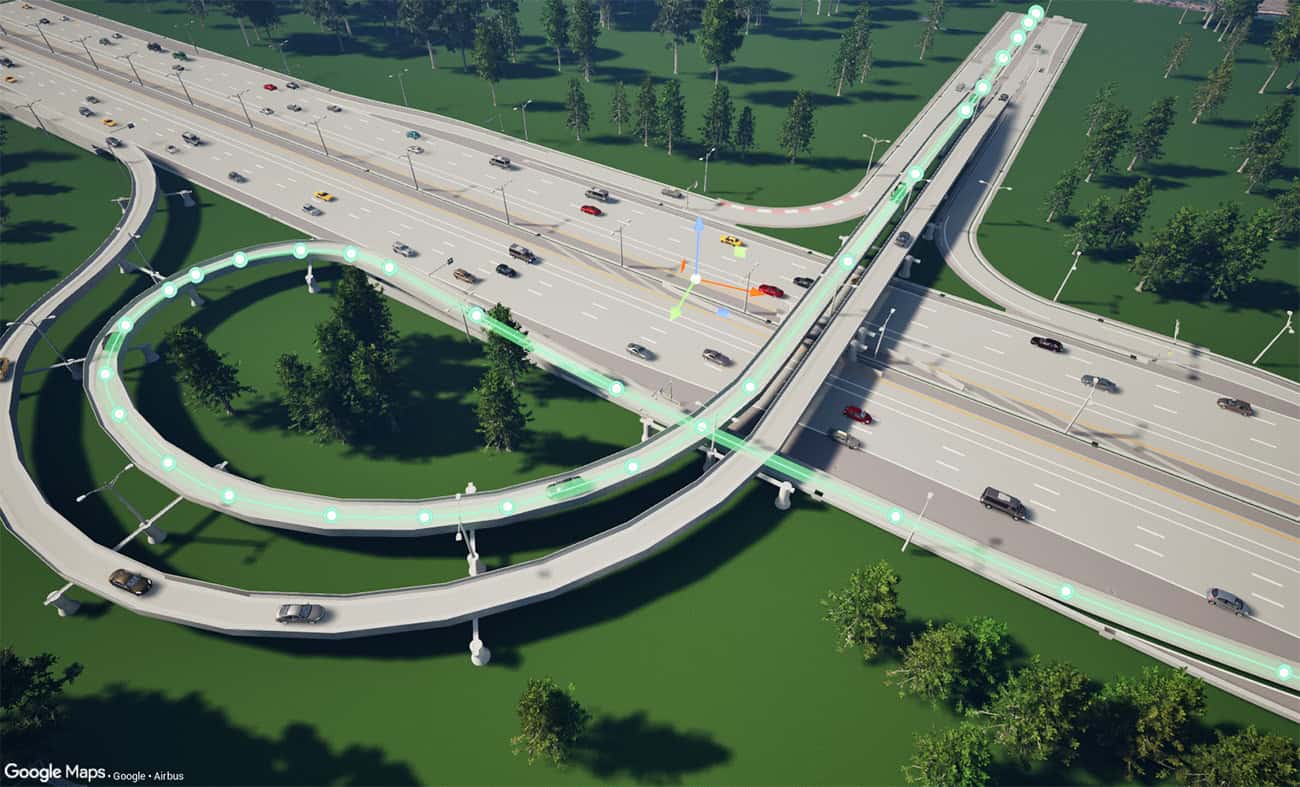
A director at a state department of transportation faces a nine-figure change order for a complex highway interchange. The evidence is a 500-page report and a set of 3D renderings that are already two weeks out of date. The team explains the proposed design changes, but the director still has to imagine their impact on traffic flow, adjacent properties, construction sequencing, and long-term maintenance. Without being able to visualize the design in context, a confident decision seems impossible. The pressure to act is immense, yet moving forward depends on truly seeing the outcome in context.
For decades, infrastructure leaders have been forced to make high-stakes decisions based on abstract project data, static visuals, and disconnected reports. This is no longer sustainable. The sheer complexity of modern projects has rendered our legacy decision-making workflows obsolete. The infrastructure sector is now at an inflection point where the next competitive advantage will come not from collecting more data, but from mastering its communication through immersive, real-time visualization.
Why our data-rich work is often understanding-poor
The root of the problem is that our methods for communication have not kept pace with our methods for design. We create sophisticated, data-rich digital twins, yet we still attempt to communicate their insights through disconnected documents, screenshots, and static images. This workflow forces stakeholders to individually interpret technical information instead of experiencing the shared project vision directly. The result is a slow, risky process where teams spend more time explaining engineering data, validating design intent, and interpreting technical drawings than making confident project decisions.
This model has reached its breaking point because the fundamental nature of project risk has changed. As projects grow to infrastructure scale—from sprawling airport expansions to city-wide water system upgrades—the financial and public consequences of a single poor decision have become too great to ignore. We are a sector that is data-rich but understanding-poor, and it is costing us dearly.
The journey from connected data to better decisions
Unlocking the value of project data requires a systematic approach. The most successful infrastructure organizations are building new operational capabilities around a clear, four-stage journey powered by real-time visualization:
- Connected data: The journey begins by unifying siloed project information—BIM, reality models, engineering designs, and 4D schedules—into a single, live, and trusted digital twin. Connected data is the essential foundation.
- Shared understanding: This transformative step translates complex, connected data into a clear, interactive visual experience. Through real-time visualization, stakeholders can explore design alternatives, validate design intent, and understand how engineering decisions influence construction, operations, and surrounding communities.
- Faster, confident decisions: With a shared visual context established, leaders can compare design options, explore scenarios, evaluate trade-offs, and validate engineering decisions in real time. They are no longer just reviewing data; they are interacting with a virtual replica of the project to make faster, more confident decisions.
- Better outcomes: This newfound clarity and speed empower teams to reduce rework, accelerate approvals, and deliver more resilient, sustainable, and profitable projects.
The critical link in this chain is moving from connected data to shared understanding. Creating a digital twin is vital, but its value is only unlocked when stakeholders can truly see and experience the insights held within it.
From reviewing data to experiencing infrastructure design
Historically, project visualization has been treated as a downstream activity. This strategy is now the single greatest barrier to progress. Leading organizations are radically redefining visualization as a core business capability for daily decision-making.
Consider an engineering firm presenting a complex 4D construction phasing plan for a major bridge replacement to its client's executive board. The plan, displayed as a detailed Gantt chart, is technically accurate but difficult for the non-technical board members to follow. They cannot easily grasp the intricate sequencing of demolition and superstructure assembly, nor can they truly visualize the impact of traffic detours during each phase.
Instead of explaining the Gantt chart, the project team transforms their 4D schedule data into a compelling, immersive visual story. During the executive review, they present a cinematic, real-time visualization of the entire construction process. The board can now see the old bridge being deconstructed piece by piece, followed by new pilings being driven, and the new bridge segments being lifted into place—all within the context of the surrounding river. They can clearly understand the traffic flow during a critical weekend detour by watching animated vehicles navigate the proposed routes.
In this scenario, the board isn't just reviewing a schedule; they are experiencing the construction plan. This visual clarity, enabled by connecting 4D data to immersive visualization platforms like Bentley’s iTwin Engage, gives them the confidence to approve the phasing plan in a single meeting, saving weeks of follow-up questions. This is the power of infrastructure-scale visualization—it moves collaboration from the abstract to the experiential.
The path forward: building a culture of visual clarity
Achieving this level of clarity is not merely a technological challenge; it is a strategic and cultural one. It requires a commitment to breaking down data silos and empowering entire teams with tools that foster visual communication and shared decision-making. Organizations must move beyond static, file-based workflows and embrace platforms built on open standards that support a live, connected data environment.
The organizations that lead the next decade will be those that communicate complex infrastructure projects with the same precision used to design them. By transforming connected engineering data into immersive visual experiences, they will create shared understanding across technical teams, executives, owners, and communities alike. In an increasingly connected world, the ability to clearly communicate project intent may prove just as important as the engineering itself.
Learn how leading infrastructure organizations are moving from interpreting complex project data to experiencing infrastructure projects in real time. Discover how iTwin Engage infrastructure visualization software helps teams transform connected digital twin and 4D construction data into clear, immersive visual experiences that create shared understanding and drive faster, more confident decisions.