Pretty much every water and wastewater system these days of any size has a SCADA (Supervisory Control and Data Acquisition) system. We just take them for granted. However, water systems were built and operated for many years before the coming of SCADA. How did they make the systems work?
Originally, of course, an operator would need to go out to the facility and manually throw a switch to turn a motor on or off. The process was inefficient, but it was all they had. If there was a chart recorder on the wall, they would take down the chart every week or so and bring it back to the office for storage. If you wanted to control anything, you needed a “warm finger on the button.” Later, controls at these remote locations were replaced by electro-mechanical controls such as pressure switches. But even these devices had problems with fault tolerance and detection.
Gradually, automation took over and control room operators were able to acquire data from telemetry systems and remotely control equipment. But this still wasn’t a SCADA system. The first SCADA systems didn’t come out until the 1970s, and they weren’t very reliable or easy to use. It was in the 1990s when SCADA systems became widely used in the water industry. Today, they are ubiquitous.
How did these early systems (before SCADA) work and how did they differ from SCADA? There are several areas.
Logic
Older control systems were based on “ladder logic,” which is a graphical way of showing how power can get through a circuit from + to -. A device would operate if you could move power from the left to the right side of the ladder through various rungs of the ladder using switches and relays as shown below.
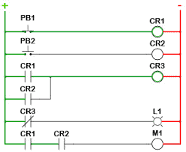
The logic was easy to visualize and is still used to some extent today; however, the relays have been replaced by digital Programmable Logic Controllers (PLCs). A digital version of ladder logic can still be used today but other programming languages are available.
Protection
There were problems with early PLCs and Remote Telemetry Units (RTUs) in terms of reliability. They use small voltage and 4 to 20 mAmp signals, a tiny current. These were hooked up to motors using 240, 480, or higher voltages. A small surge from one of these motors could fry the guts of the PLC. The solutions here include solid state/electromechanical relays or diodes/optoisolators, which can convert electrical signals to light, cross a gap, and trigger a conversion of that signal back to electrical with no chance of damaging the PLC.
Telemetry
Getting signals from a remote site to the main control room was not cheap. Usually, this was done over phone lines, but keeping phone lines connected 24/7 was expensive. In many cases, the data could be kept on the RTU, which could keep a day’s (or hours’) worth of data and send it in as a batch, usually at night. There would also be “report by exception,” where if the RTU detected a serious problem, it would dial up immediately and usually trigger an alarm. Today, there are more options for moving data around.
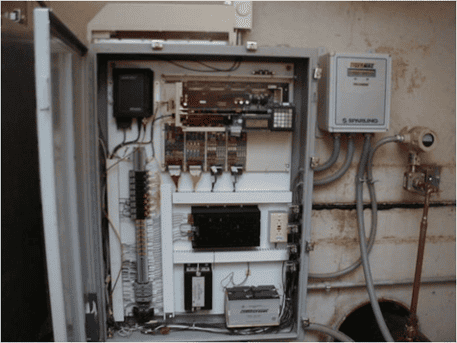
Depending on who you talk to, the relationship between an RTU and a PLC is fuzzy. Both are essentially rugged, industrial computers. I see RTUs as being a PLC that can be used to operate a remote system, but if you ask 10 people, you’ll get 10 different answers.
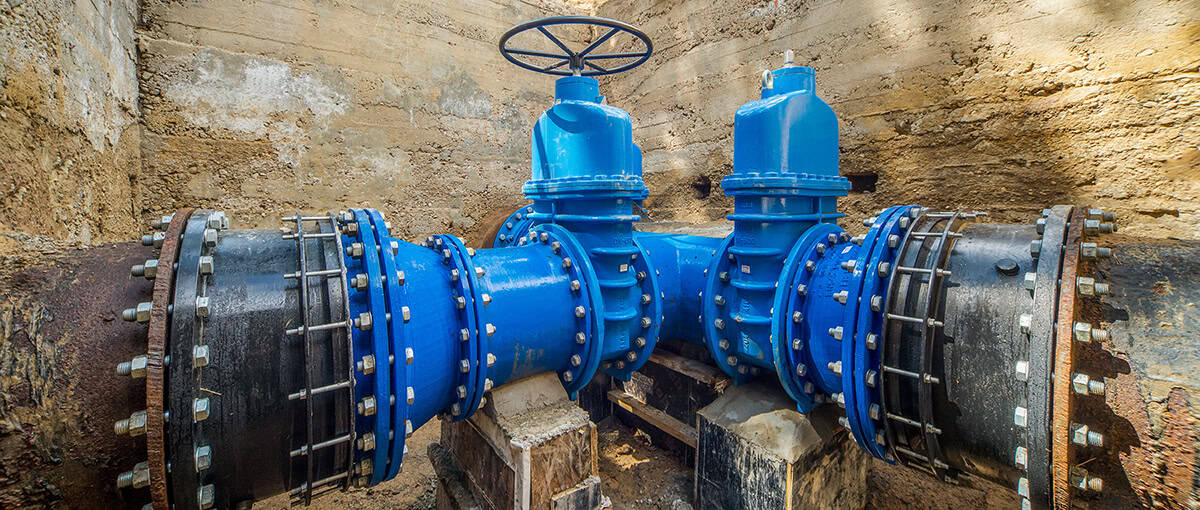
This is what a PLC could look like.
Display
Viewing the data that comes in from remote locations is a key feature of SCADA systems. In the past, numerical values would be displayed with analog gauges on the wall. They could also move the pen on a strip chart or circular chart.
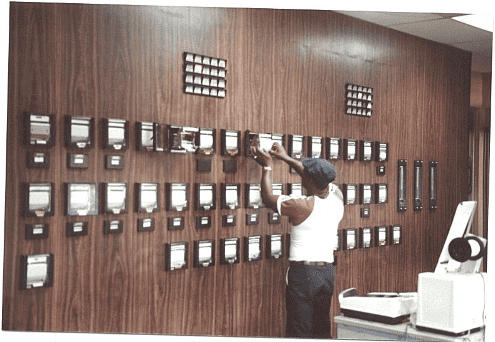
If an alarm came in, it would be displayed on an Annunciator Panel, which was made up of rows of translucent plastic with some message such as “Low Level at South Tank.” Sometimes, the item would be color-based on the nature of the signal. Usually, a red cell would indicate the most severe problem.
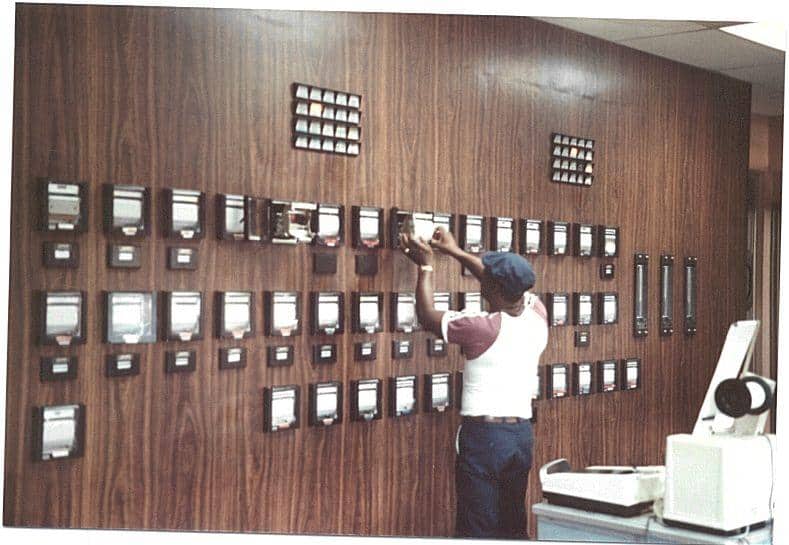
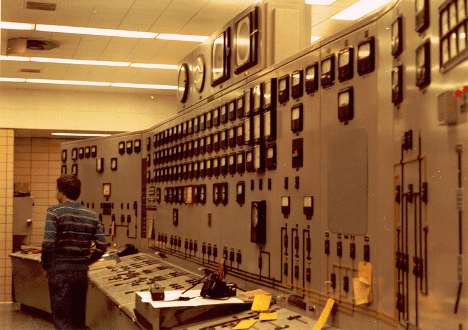
Here’s a picture of an old control room. The strip charts are at the bottom while the annunciator panel is at the top.
Here is another main control room for a large utility. Notice the lack of monitor screens.
Nowadays, these devices have been replaced by a Human Machine Interface (HMI), which is analogous to a “glass cockpit” on an airplane. With an HMI, an operator can move between displays with a mouse click and the monitor would display any screen you can come up with.
Early control rooms often had huge maps of the distribution system covering a wall. At every facility on the map, there would be colored lights, indicating the status of that facility. These were very impressive but difficult to maintain when a new facility or RTU was added.
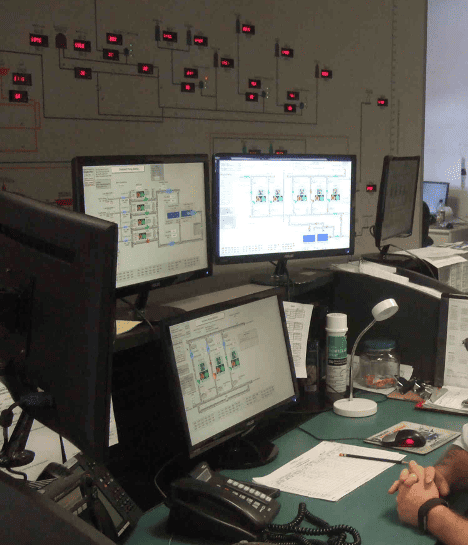
In some cases, the wall map was not dismantled when the SCADA HMI was eventually installed. Here are pictures of such facilities. Contrast the wall map in the background and the HMI screens in the foreground.
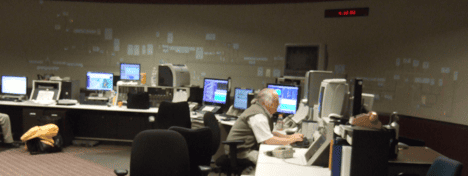
Just because the data are displayed in an HMI, it doesn’t necessarily mean that it is laid out well.
Here is a link to an article about developing a great HMI for your system:
Data Storage and Retrieval
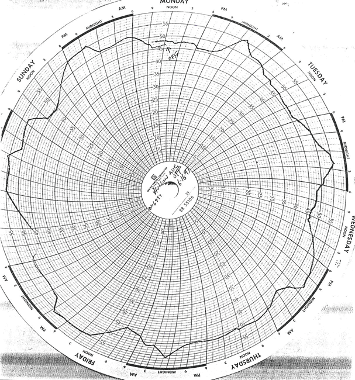
Today, data are stored digitally in some type of database, which can be viewed through a historian. While the HMI can show you what is going on, the historian can show you what happened. These historians can usually do queries, trending, and report generation. Back in the day, data were captured on analog strips or circular charts. These provided a good picture of the data, as long as you didn’t let the pens run dry.
The circular charts would be placed on a spindle, and you can imagine how bulky that could be. The strip charts were even messier. Suppose you had a strip chart for October 1996, and you wanted to know tank levels on 6 October. You would need to unravel the chart until you got back to 6 October. This discouraged the review of data. Using the pen data for calculations required manually reading the chart, which limited its usefulness in calculations for decision support.
Here is what typical chart data looked like for a week at a tank.
Originally, all the RTU manufacturers had their own proprietary protocols, and sharing data was impossible. In the mid-1990s, the OPC Foundation established OPC (Object linking and embedding for Process Control), which can enable data sharing.
While in the past, control system designers needed to be parsimonious in selecting only the most important parameters to capture and store, today it’s possible to store a vast array of data for any property, at any site, at a very fine time increment. (With that, the power used at data centers and greenhouse gases created for data storage―and backups and backups to the backups …―is growing.)
While digital data are much easier to work with, they also make it possible for malicious actors to damage or destroy your data or hold it for ransom. Cybersecurity has become a major component of SCADA.
Summary
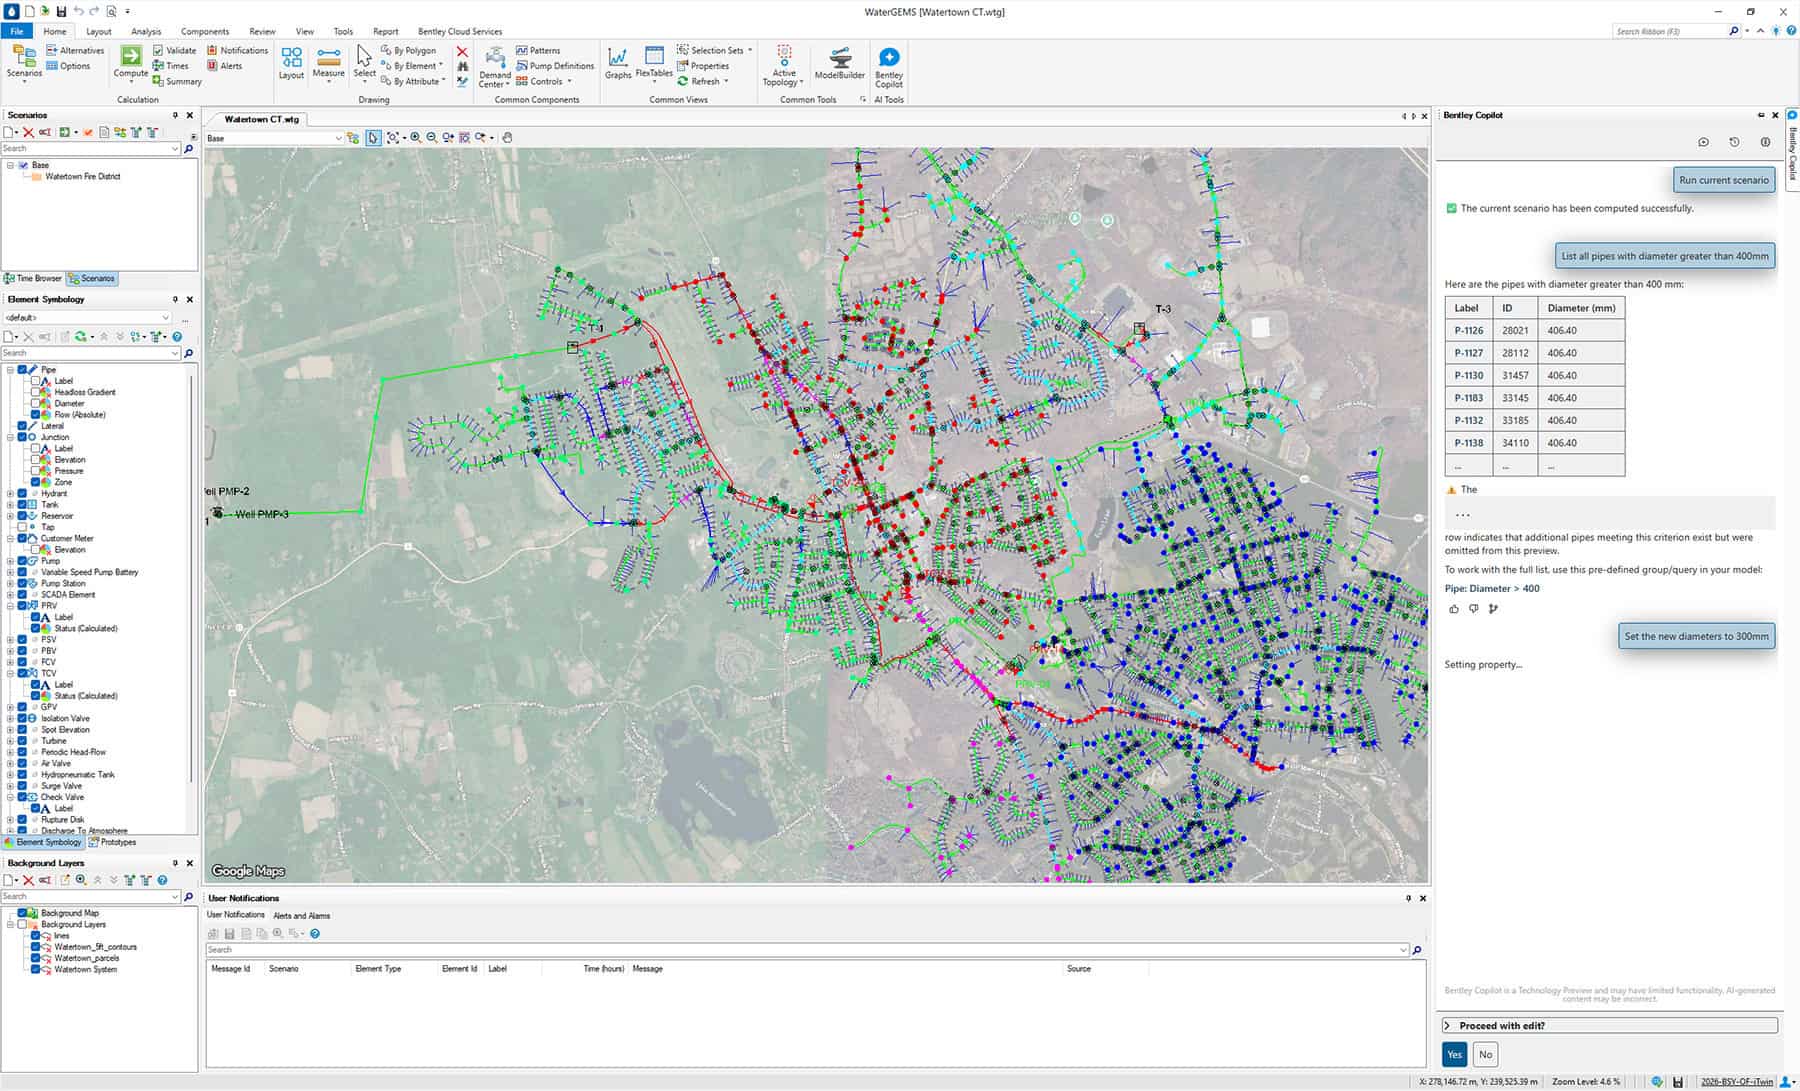
We’ve come a long way from a time when data were scarce and expensive to a time when we are drowning in data. Digital twin technology with machine learning offers hope that we can productively use all this data.
If you enjoyed this blog about the history of SCADA, you may also like a podcast I did recently on the history of water distribution hydraulic modeling.
https://weupodcast.podbean.com/e/future-of-intelligent-infrastructure-series-part-1/
Thanks to Bill Teodecki, Corporate Automation Engineering Lead, Aqua America, for his helpful comments on my initial draft.
If you want to contact me (Tom), you can email [email protected].