That’s a lot of acronyms for one title. Hopefully, if you are reading this blog you know that RDII stands for Rainfall Derived Infiltration and Inflow, while RTK is not an acronym at all.
The main idea behind wastewater collection systems is to get wastewater to the treatment plant. Wastewater treatment plants work best with a nice steady inflow. When the flow increases due to wet weather, the excess flow can overwhelm the plant. The alternatives are to overflow from the collection system or bypass the plant—both undesirable. Excessive I&I can lead to water quality problems and associated enforcement actions.
Wastewater engineers and operators invest a great deal of energy trying to reduce I&I (Infiltration and Inflow) and collection system models like OpenFlows SewerGEMS are a powerful tool in their toolbox to assess the problem and develop solutions.
The overall process is simple:
- Precipitation (or snowmelt) occurs
- Stuff happens
- Excessive I&I enters the sewers
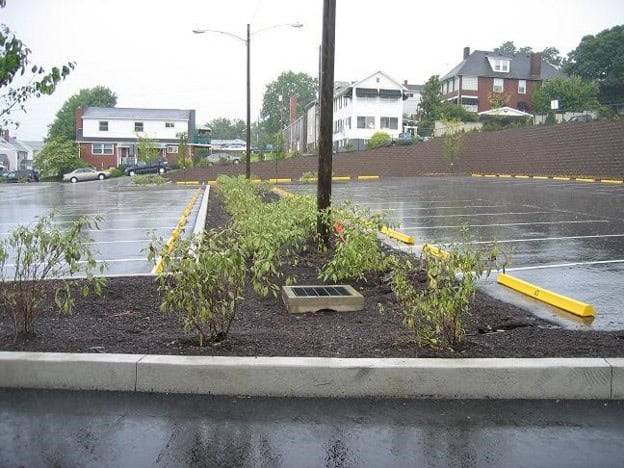
In a combined sewer system, the places where wet weather flow enters the system are mostly inlets/catch basins. These locations are mostly known and there are hydrologic methods contained in modeling software to calculate those inflows.
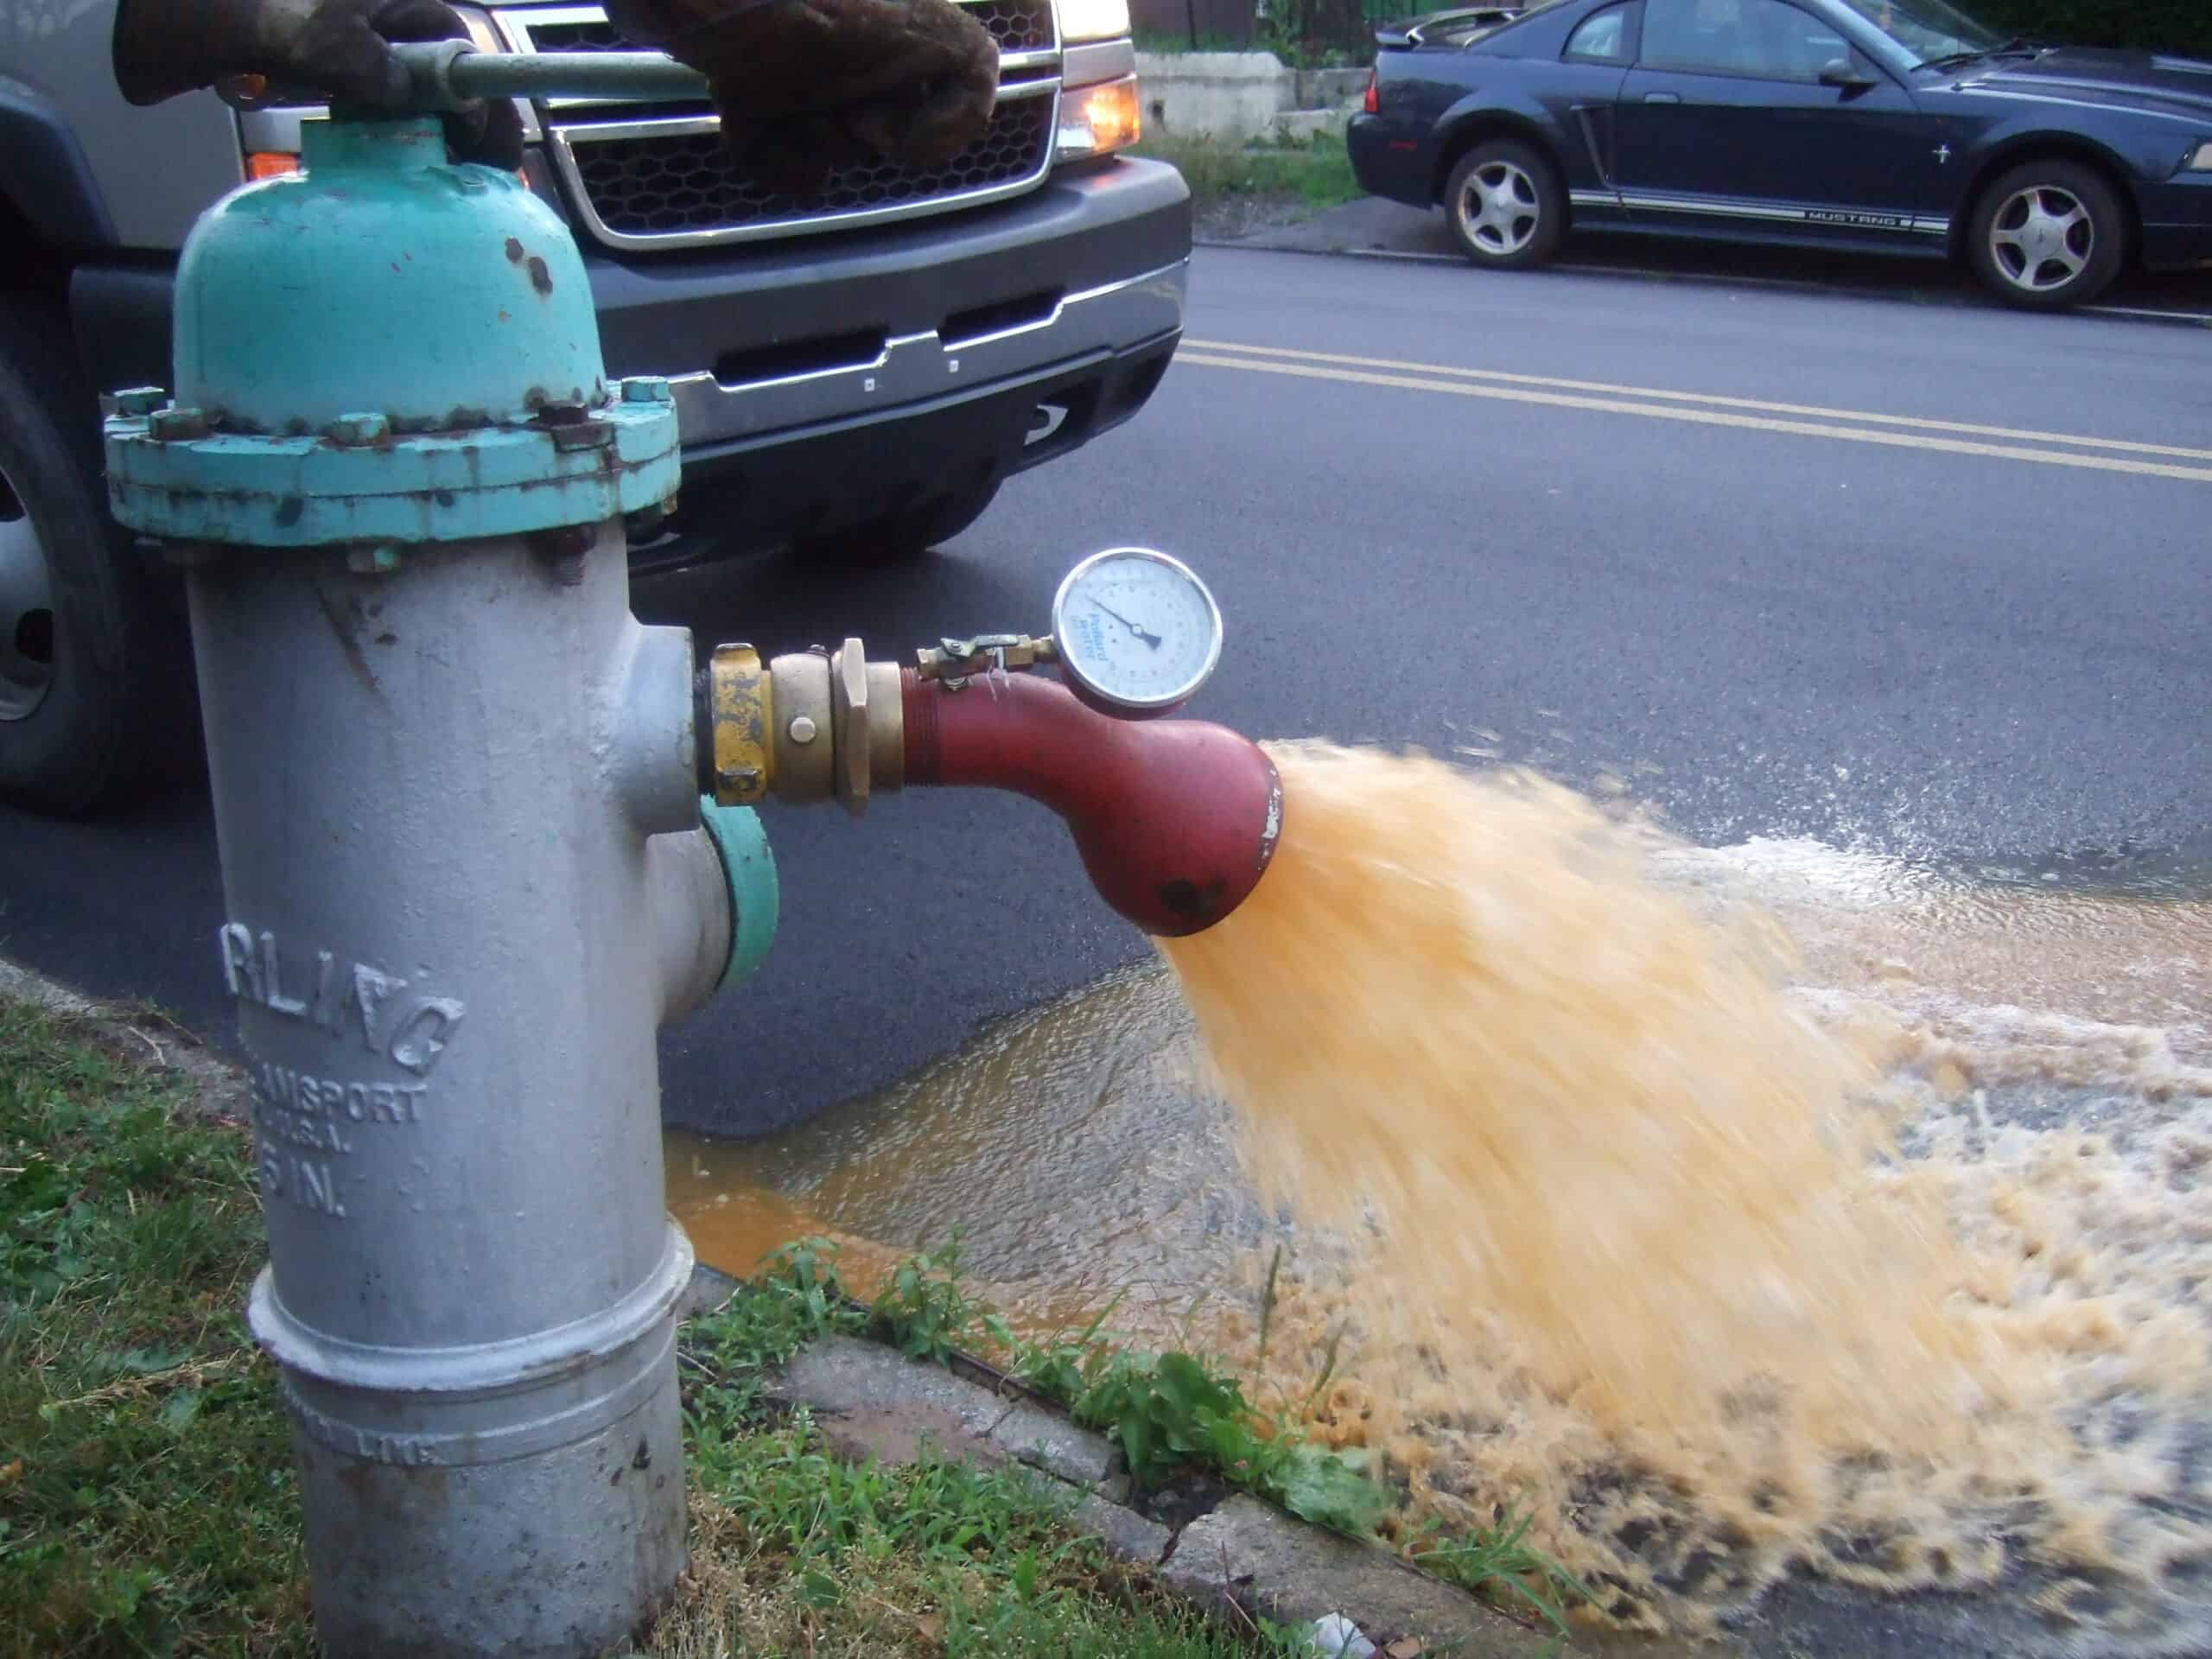
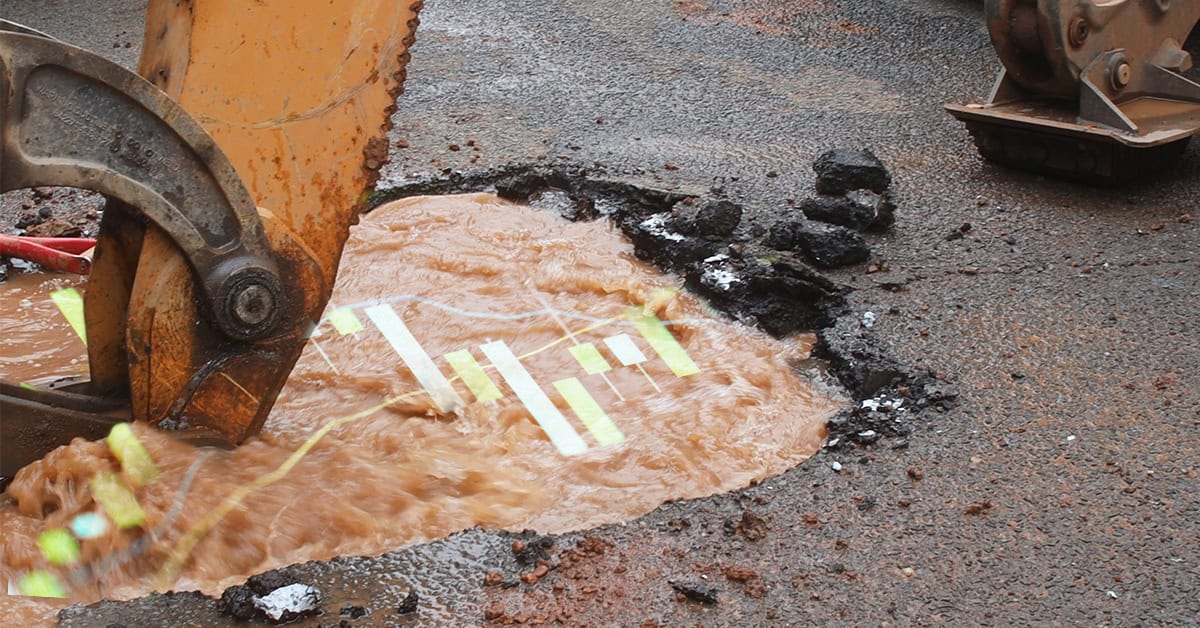
In a separate sewer system, there should be no I&I and the fact that it does occur (and sometimes in large quantities) means stuff is happening. There are many ways that I&I can get into sanitary sewer-cracks in mains, laterals and manholes, roof and building drains and sump pumps connected into sewers, and catch basins connected into sewer are just a few.
But if you don’t know the exact location of the I&I, unlike for combined sewers, modelers need to use other methods to calculate the hydrograph for the I&I. Over the years, numerous methods to develop such hydrographs have been proposed with varying levels of accuracy.
The requirement is to develop a method to produce hydrographs based on a simple and reproduceable approach using data that are readily available. The most successful methods can reproduce the total quantity of I&I, the time to peak and the duration of the recession limb of the hydrograph.
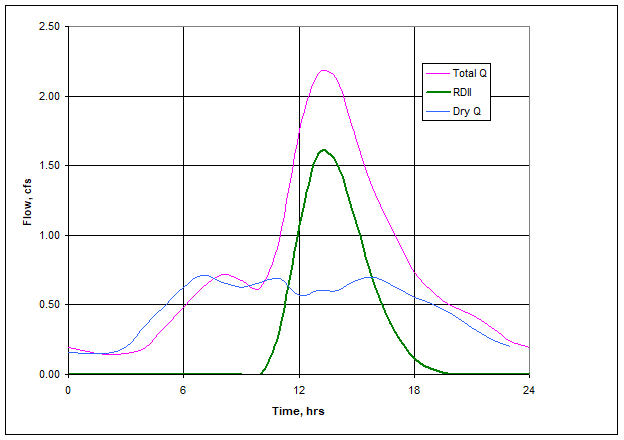
Subtracting out the dry weather flow results in hydrographs that look something like the green line in the figure below (but usually not as nice).
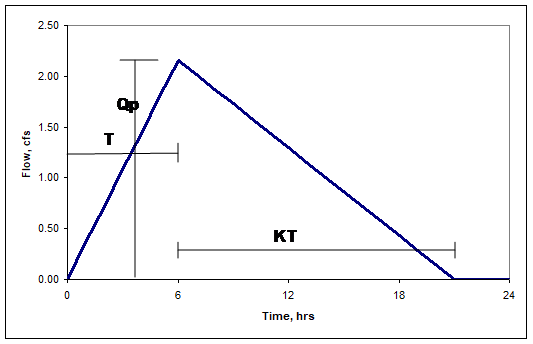
The math behind the equation above can get messy so the hydrograph can be approximated by a triangular hydrograph which greatly simplifies the math. Using simple geometry, the hydrograph can be represented by three quantities – peak flow, time to peak flow and length of rescission limb. However, rather than using the actual peak flow with units, it is better to use the ratio of volume that gets into the sewer divided by total volume of rainfall. This property of a catchment is called R.
Given actual volume of flow from a flow meter and rainfall volume from a rain gage (depth of precipitation and catchment area), it is possible to calculate R. You can determine the time to peak (T) by inspection of the hydrograph at your flow measurement location. Similarly, K is the ratio of the length of the recession leg of the hydrograph to the rising leg. Usually, it’s around 1.7.
Therefore, given the rainfall, the catchment area, and measured hydrograph, it is possible to calculate R, T, and K and apply them to different size storms.
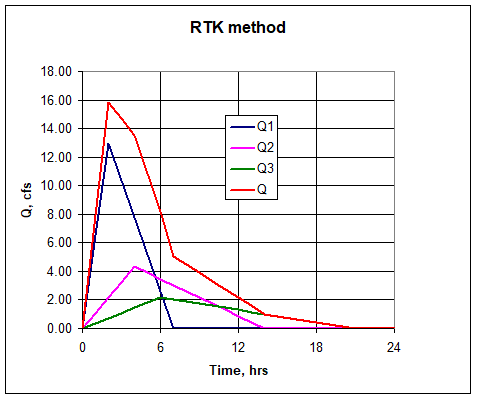
Real hydrographs don’t look like perfect triangles. There are multiple paths and mechanisms for wet weather flow to get into sewers. If every path was known and measured, it would be possible to calculate a triangular hydrograph for each. However, real systems are too complex for this. It is possible to group the I&I into three general categories to cover different mechanisms. These are called
- Inflow
- Fast infiltration
- Slow infiltration
RTK coefficients can be developed for each of these hydrographs, and they can be combined as shown below to arrive at a reasonable overall I&I hydrograph (red line).
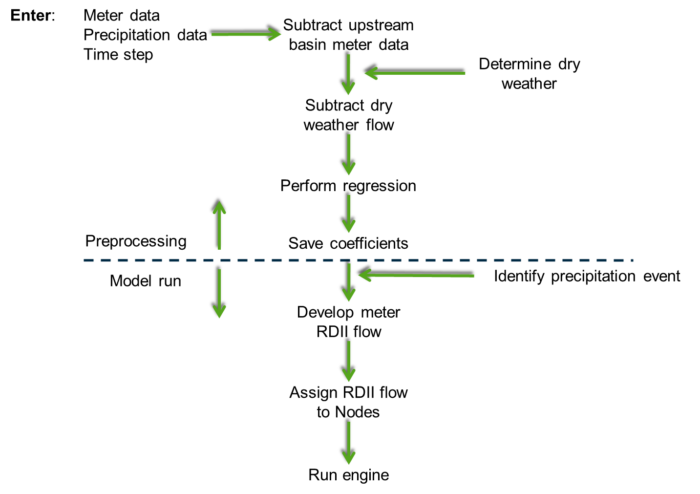
Applying the RTK method generally, follow the steps below. There is a calibration preprocessing step (above the dashed line) to develop the RTK coefficients followed by using the coefficients for a given precipitation event (below the dashed line).
The RTK method is used in SewerGEMS/SewerCAD and other collection system models.
The method is not perfect. An overflow upstream of the flow meter can impact the results, the rainfall events used to determine R, T and K may be different from the events for which the method is applied, snowmelt will create different coefficients than rainfall and any one of the inputs can contain errors in measurement. Nevertheless, the RTK method is widely used and is adequate for most applications.
Using the RTK method can be an important component in calibrating a sanitary sewer collection system model. For more details and a related video, see our wiki.
Want to learn more from our resident water and wastewater expert? Join the Dr. Tom Walski Newsletter today!

