Selecting the right pump for a wastewater force main that has a single pump station is usually straightforward. Generate the system head curve, find a pump whose operating point lines up with the pump’s best efficiency point and the design flow rate.
Notice that I said system head curve (not curves). We know that the system head curve is not a single curve but a band of curves depending on the water level in the wet well and pressure in the force main. However, for a simple force main, the band of system head curves is narrow as the fluctuations in wet well depth is minimal.
This is not the case when the force main has multiple pumps and pump stations discharging into it. In this case, the system head curve can vary widely. Systems like this are generally found in flat terrain where these is insufficient slope to the land to provide velocity to make the pipes self-cleaning. Since gravity flow isn’t sufficient, a force main must be used.
The model below may be typical of a force main with 5 pumping stations.
WaterGEMS and WaterCAD have the best combination of tools for modeling this type of system even though it is intended for wastewater pumping.
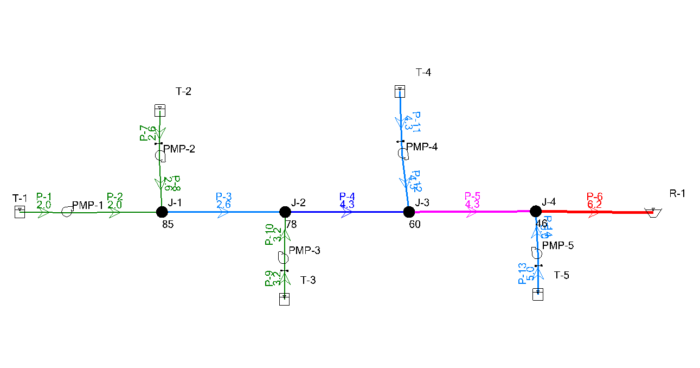
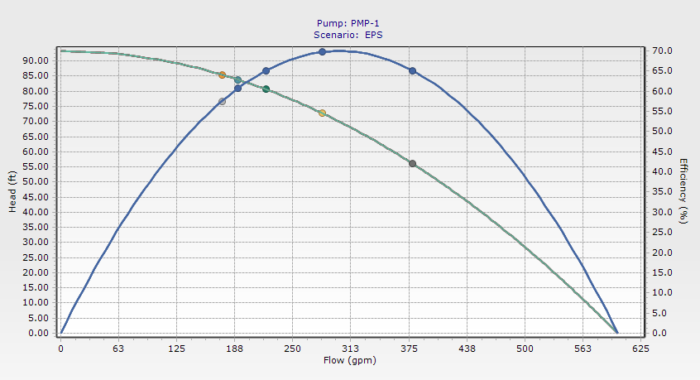
The pump at the most upstream end of the system may have a design flow of 300 gpm. However, when it runs by itself, it will discharge 380 gpm. When a second pump turns on, the discharge from this pump can drop to 280 gpm. When all five pumps are running during a peak loading time, the pumps end up competing for the capacity in the force main and the upstream pump will only be discharging 170 gpm (and possibly not keeping up with inflows). Not only does this affect the pump discharge but running at this flow also hurts efficiency, which drops from its nominal 70% to 55%.
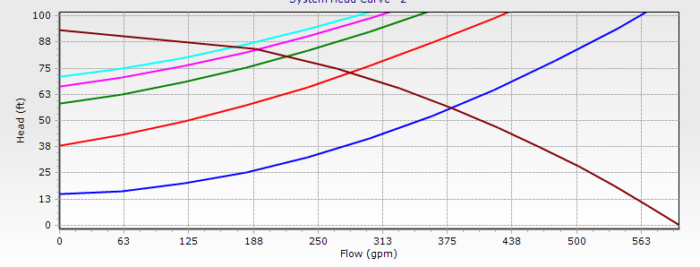
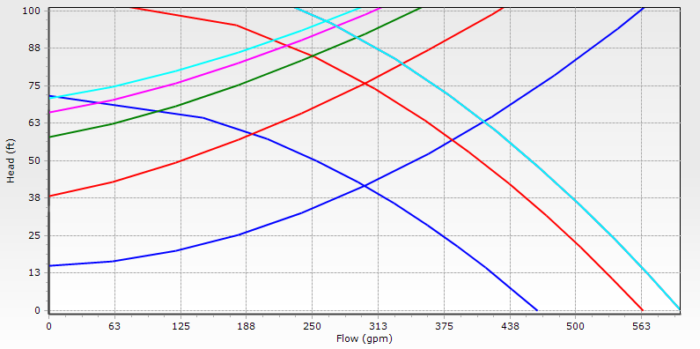
A good way to understand this drop in flow is to view the system head for different combinations of running pumps. As the number of pumps increases, the system head curves shift up and to the left, corresponding to a reduction in flow. There is no constant-speed pump that can run efficiently over such a range of conditions.
One solution is to use a variable speed pump that will adjust its speed to match the system head curve and wet well inflow. In this case, the efficiency of the operating points remained similar but the head against which the pump would discharge dropped significantly, resulting in energy savings. There is an individual curve head and efficiency characteristic curve for each speed, unlike the constant speed curves above which has only a single head and efficiency curve.
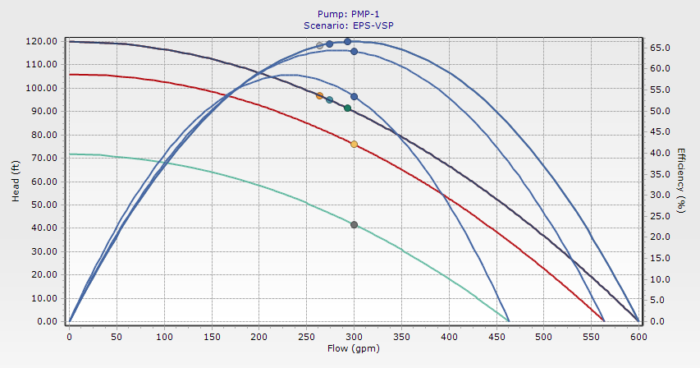
This can be better understood by viewing the system head curve. In this example, the variable speed pump was controlled to produce a known flow. The intersection of curves of the same color represent the individual operating points. For example, red system head curve intersects red pump curve at (300, 75).
Other solutions to this problem might include using two different pumps in the system, one with a high head and one with a low head. Another might be to oversize the pipes to minimize friction losses (but this might result in a very low velocity).
Another complicating factor is that not all pump stations may come online on day one. Instead, the service area may be built out over a period of years. It’s important to check the design for different loading conditions over the evolution of the system.
Want to learn more from our resident water and wastewater expert?
Join the Dr. Tom Walski Newsletter today!


