This blog is part of a guest learner series written by Ian Fisher, Ph.D., adjunct professor, Western Sydney University Water Group, Sydney, Australia. For a preliminary discussion, please email: [email protected] or [email protected].
Definition of Cost-Effective Strategies to Include Disinfection By-Products
In the blog A Multi-Species Decay Model to Support Cost-Effective Chlorination in Distribution Systems, a cost-effective chlorination strategy is defined as the least-cost combination of doses (locations and rates) that achieves effective chlorination for a given stable flow regime and water temperature. Searching for such a strategy requires extended-period simulations for many dosing location and rate combinations.
With the realization that chlorination generates disinfection by-products (DBPs) that are harmful to human health, water utilities are now required to keep concentrations of some of these DBPs below specified levels. For example, the U.S. Environmental Protection Agency (USEPA) requires trihalomethane (THM) levels to be kept below 0.08 mg/L. Consequently, effective chlorination strategies are now only those that meet such requirements while maintaining free chlorine above a detectable level to system extremities.
Incorporating By-Product Formation into the 2R/2RA Chlorine Bulk Reaction Models
Additionally, in the previously mentioned blog, incorporating the 2R or 2RA multi-species models of chlorine reactions in OpenFlows WaterGEMS MSX or OpenFlows WaterCAD MSX was shown to provide an accurate and efficient means of assessing the effectiveness of any chlorination strategy proposed for a distribution system. We can also include the new limitation on any DBP by adding it as another species to the 2R/2RA chlorine-reaction model and relating its rate of formation to the amount of chlorine reacted (since the initial chlorine dose).
For example, we can define total THMs as an additional species THM [mg/L]. Its long-term rate of formation is linearly related to the amount of chlorine reacted (Clark (1998). The slope of this line is the THM yield, denoted kTHM [mg TTHM/mg Cl reacted], which can be added after KS to the [COEFFICIENTS] section of Tables 1 or 2 that define the 2R and 2RA models in the aforementioned blog. Then the rate of THM formation can be added to the [PIPES] section so that the THM concentration is calculated everywhere during an extended period simulation.
[SPECIES]
| ; Type | Name | Units | |
|---|---|---|---|
| BULK | THM | MG/L | ; Total THM concentration |
[COEFFICIENTS]
| ; Type | Name | Value |
|---|---|---|
| CONSTANT | KTHM 0.043 | ; total THM yield [mg THM/mg Cl reacted] |
[PIPES]
| ; Type | Name | Expression | |
|---|---|---|---|
| RATE | RTHM | -KTHM*(RF + RS) | ; Rate of THM formation |
| [mg/L/h] |
Table 1. Additions to Tables 1 or 2 of the previous blog to include total trihalomethanes in the 2R or 2RA bulk chlorine MSX models.
Across a wide range of U.S. and Australian waters with quality in the operating range of pH (7-8.2) and Br concentration (<0.2 mg/L), the THM yield was recently found to be similar (Sathasivan et al. 2020). The average yield and standard deviation were respectively 0.043 and 0.008 mg-THM/mg-Cl. For an initial prediction of THM concentrations within a system, this average yield could be used in the MSX module without the need for any sampling or chemical analysis for THMs. This default value has been used in Table 1.
To develop a more accurate yield for an individual source, THM concentration can be measured in a (quenched) sample, which is withdrawn from water undergoing a chlorine decay test. The corresponding chlorine concentration [Cl] is also measured immediately before quenching. If this is done at times 1 and 2, then
Yield = [THM2-THM1]/[Cl1-Cl2]
Samples should be quenched with sodium thiosulphate at the time of sampling to rapidly reduce chlorine to zero and prevent any further THM formation before analysis. This procedure should be repeated to obtain at least three points to confirm linearity on a plot of TTHM vs. Cl consumed. One of these points should be derived for the greatest amount of chlorine consumption at the end of the rechlorination decay test. If booster chlorination occurs between times 1 and 2, then the net increase in chlorine due to each boost must be added to the denominator of the yield equation above to calculate the total chlorine consumed in that time period.
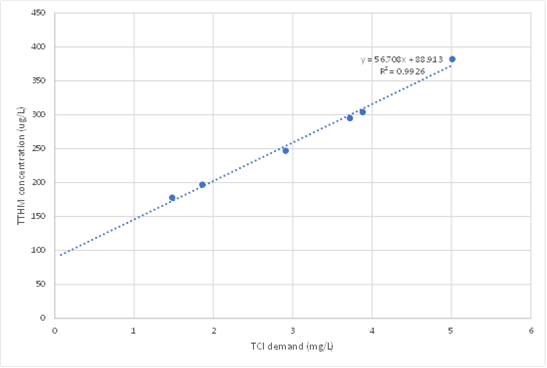
Figure 1 – Total trihalomethane (TTHM) formation resulting from corresponding chlorine demand in Hervey Bay filtered water. Note the regression does not pass through the origin because pre-chlorination at the WTP resulted in 0.09 mg/L THMs before decay tests were conducted. Data from Fisher et al. (2021).
The slope of a linear regression on these points gives the best estimate of the yield to use in MSX. The intercept (on the THM axis) should be almost zero if the long-term proportionality between THMs and Cl consumed built into the THM model is valid. A substantial positive intercept (as shown for real water in Figure 1) indicates that some treatment process has generated THMs before the filters (e.g. pre-chlorination) and the initial THM concentration must be set accordingly in the OpenFlows WaterGEMS or OpenFlows WaterCAD model at the fixed head source. A substantial negative intercept indicates that non-productive reactions occur soon after initial dosing, which can be represented with a simple modification of the fast reaction in the 2R/2RA model (Sathasivan et al. 2020).
There are four THM species that are usually considered to comprise total THMs in the context of drinking water. Some drinking water quality guidelines (e.g. World Health Organization) are now written in terms of a weighted average of the individual THM species rather than their total, because of the marked difference in their individual toxicity. Sathasivan et al. (2020) showed that the long-term formation of individual THM species was also linearly related to the amount of chlorine reacted since initial dosing, just as is the total. Consequently, effective disinfection strategies with respect to the weighted averages of individual THM species can be identified by defining these linear relationships and incorporating them in the multi-species model, just as was done for TTHMs above.
Including Other Disinfection By-Products
Haloacetic acids (HAAs) are the other major regulated group of disinfection by-products associated with chlorination. These can be included in a MSX model in a similar way to THMs.
Further Information and Assistance with the 2R and 2RA Models
The 2R and 2RA models have been developed and applied to numerous distribution systems over more than 20 years. THMs were included as an additional species a few years later (Fisher et al. 2004). Detailed information is contained in the journal articles listed below. A framework for using these models (with an associated wall-decay model) to find cost-effective chlorination strategies is also listed (Fisher et al. 2018).
The models’ originators, Ian Fisher and George Kastl, are now members of the Western Sydney University Water Group, led by Dr. Arumugam (Sathaa) Sathasivan, Professor of Water and Environmental Engineering, within the School of Engineering, Design and the Built Environment.
The group would be pleased to assist water utilities in applying these models to their specific distribution systems by advising on, or conducting, the appropriate decay tests and the derivation of coefficients from them. Please note, after a preliminary scoping discussion, the costs of staff time and resources involved would need to be covered by the client.
For a preliminary discussion, please email: [email protected] or [email protected]
References
Fisher, I.; Kastl, G.; Sathasivan, A., (2011). Evaluation of suitable chlorine bulk-decay models for water distribution systems. Water Research 45(16), 4896-4908.
Fisher, I; Kastl, G; Sathasivan, A., (2012). A suitable model of combined effects of temperature and initial condition on chlorine bulk decay in water distribution systems. Water Research, 46(10), 3293-3303.
Fisher, I., Kastl, G., Sathasivan, A., and Catling, R. (2021). Modelling chlorine residual and trihalomethane profiles in water distribution systems after treatment including pre-chlorination. Journal of Environmental Chemical Engineering, 9, 105686
Fisher, I., Kastl, G., Sathasivan, A., Chen, P., van Leeuwen, J., Daly, R. & Holmes, M. (2004). Tuning the enhanced coagulation process to obtain best chlorine and THM profiles in the distribution system. Water Science and Technology: Water Supply 4(4), 235-243.
Fisher, I., Kastl, G., Shang, F., Sathasivan, A., (2018). Framework for Optimizing Chlorine and Byproduct Concentrations in Drinking Water Distribution Systems. Journal American Water Works Association 110(11), 38-49.
Sathasivan, A., Kastl, G., Korotta-Gamage, S., Gunasekera, V., (2020). Trihalomethane species model for drinking water supply systems. Water Research, 184, 116189.
Want to learn more from our resident water and wastewater expert? Join the Dr. Tom Walski Newsletter today!

