I’ve given quite a few presentations on saving energy in pumping. Recently, I’ve been working with Eric Dole from Garver on the chapter on pumping energy in an upcoming AWWA Manual (M83) on Energy. One of the key things I’ve been doing is cleaning up the workflow I developed for conducting a pumping energy study. Here’s the latest version of what that workflow looks like.
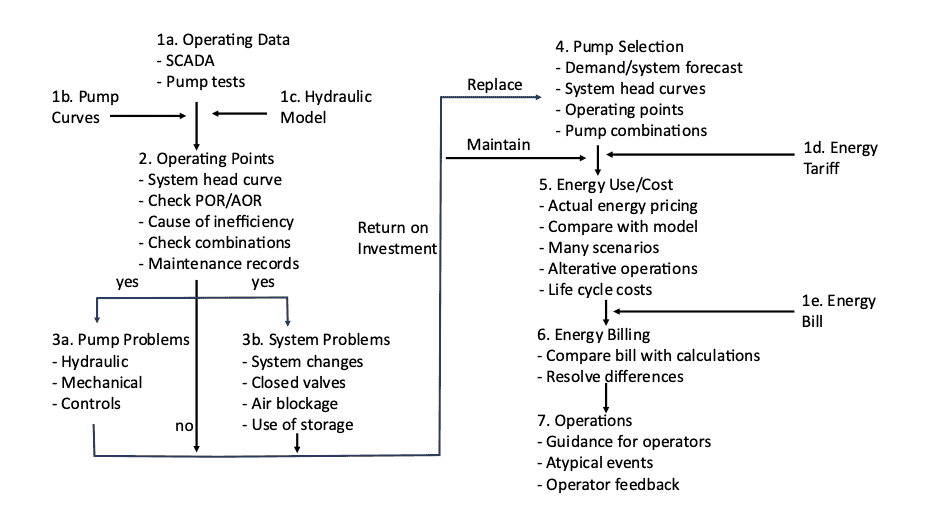
The general steps are listed below with some specific tips for WaterGEMS users:
1a. Collect operating data on pumps from the SCADA system and perform tests on pumps that look like good candidates for energy savings.
1b. Locate original pump curves and curves from any recent tests or conduct pump testing.
1c. Check the hydraulic model to ensure it is calibrated in terms of pumping performance.
1d. Locate the tariff document that explains how the power company charges the water company for energy.
1e. Locate recent energy bills.
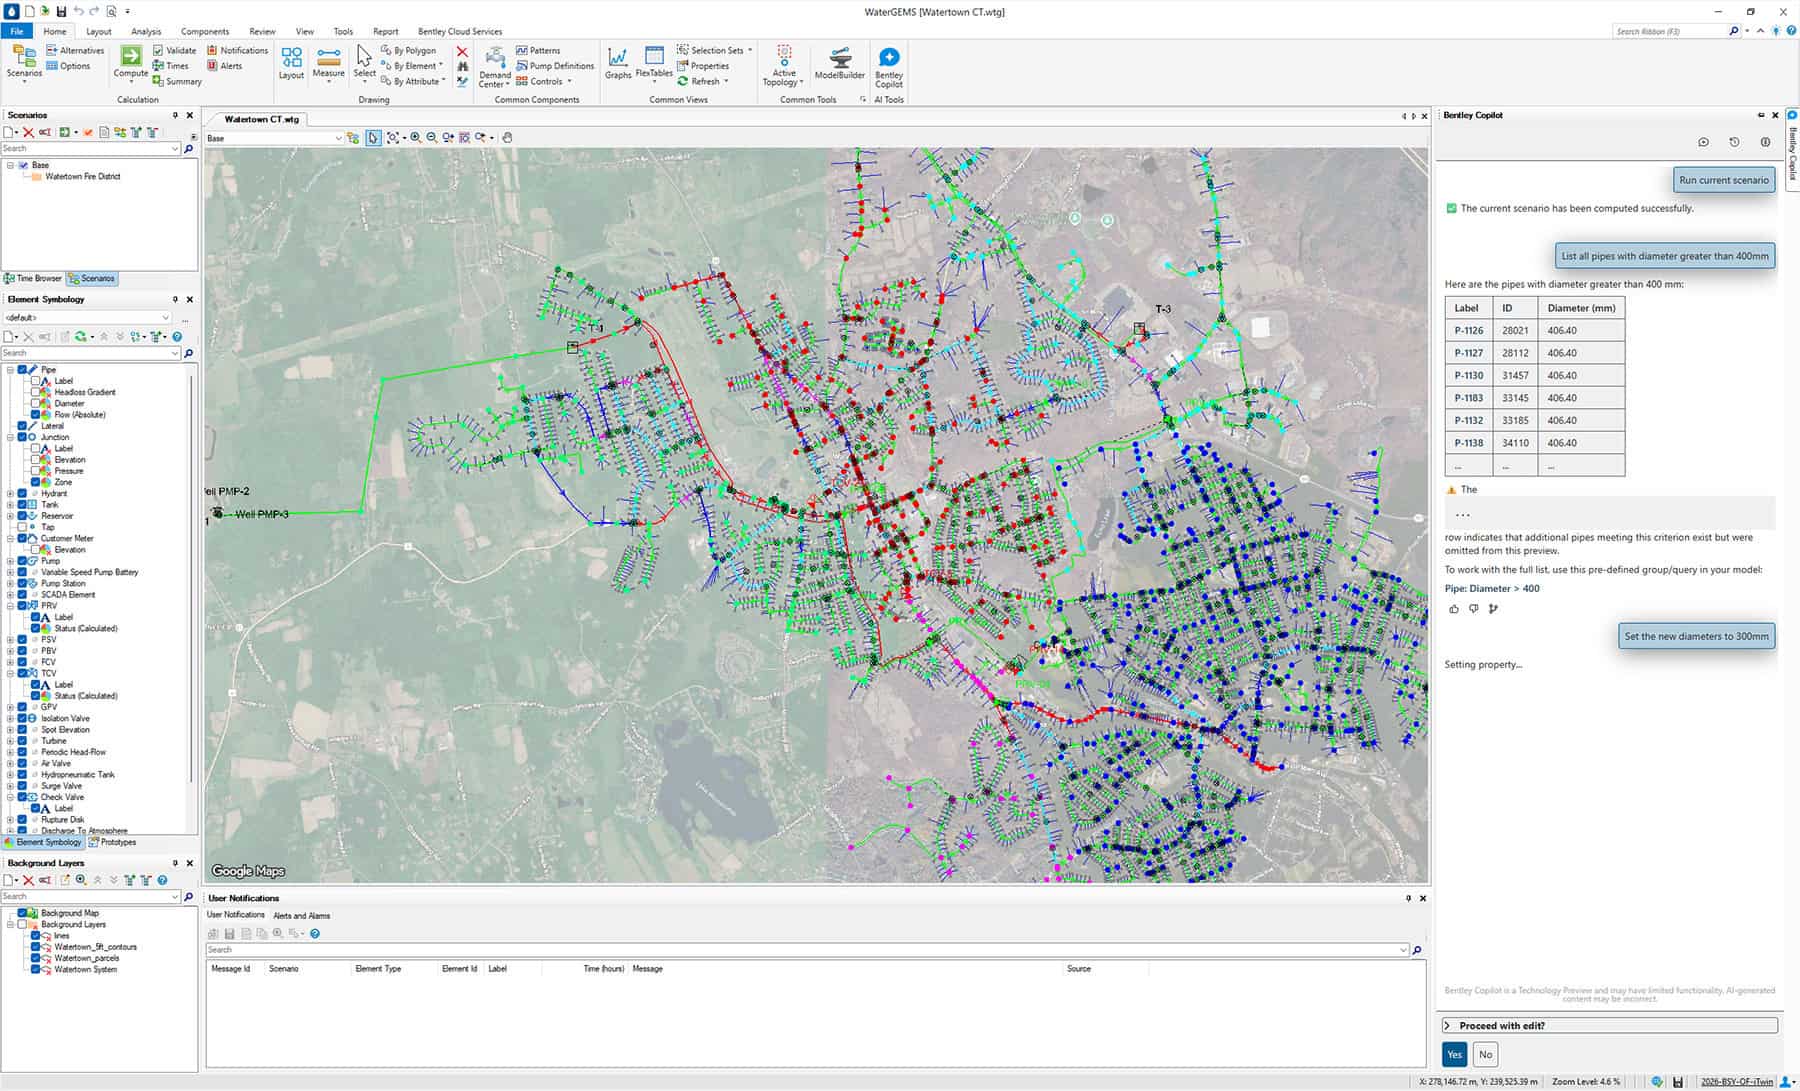
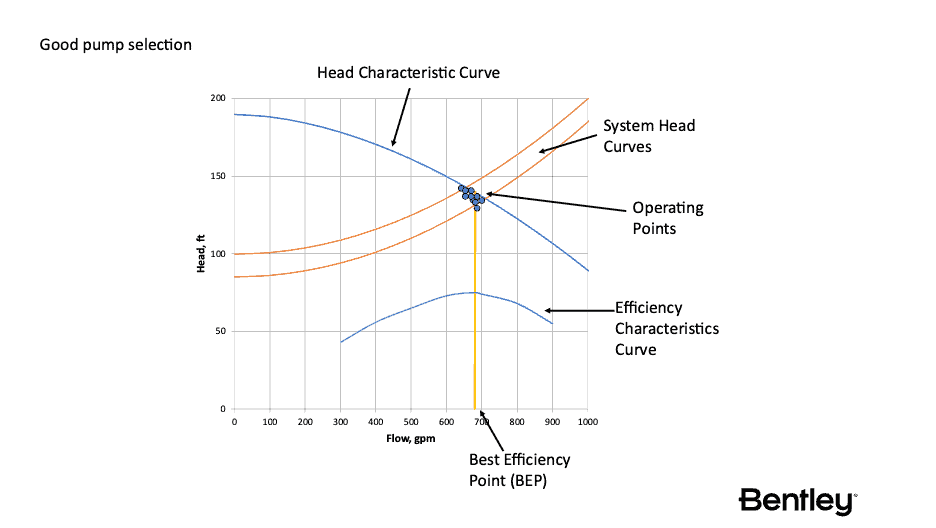
2. Determine the pump operating points from the data in 1a. Right click on Pump element > Pick Pump Curve.
Calculate the system head curve (use model if available). (Right click on Pump > Pick System Head Curve (select time step if needed)
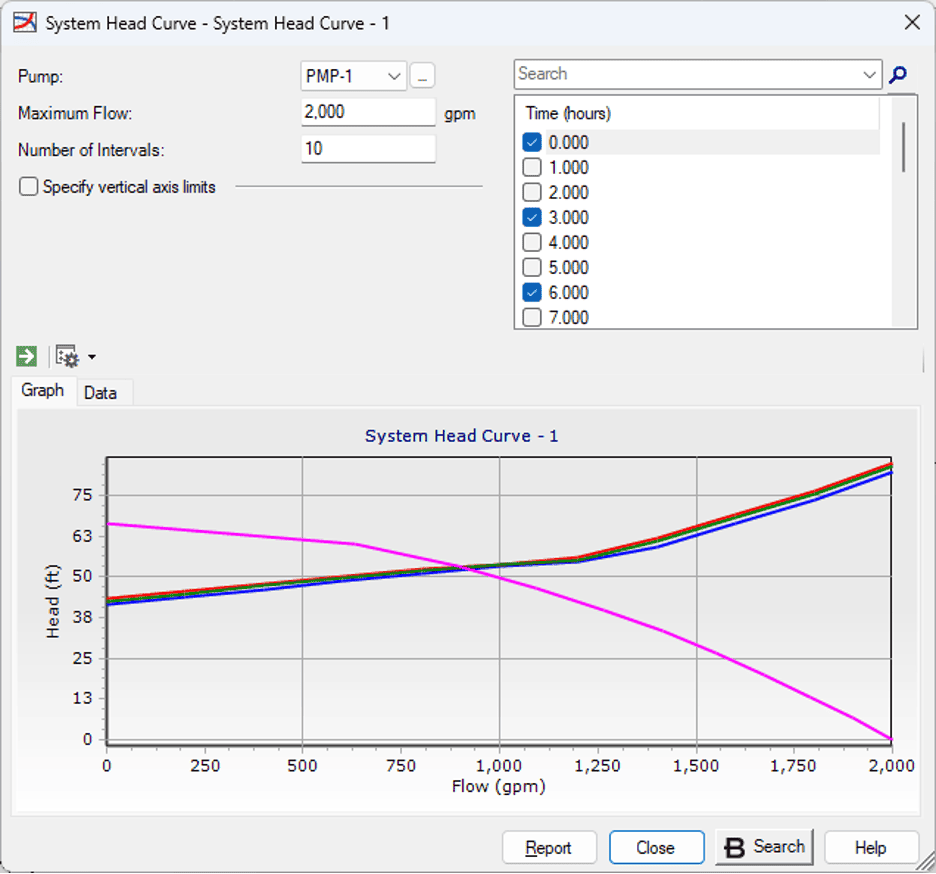
Check if the operating points from the model agree with the measured values. Resolve any differences. Check how the operating points correspond to the pump’s Preferred Operating Range (POR) and Allowable Operating Range (AOR). Check how running different combinations of pumps affects the operating points. Review maintenance records for pumps with problems or high consequence of failures. If there are problems, determine if they are pump (3a) or system (3b) problems.
3a. Pump performance problems show up as pumps not operating on their pump curves. These can be caused by incorrect clearances, unbalanced three-phase power, worn or damaged impellers, corrosion in pump casing, poorly set controls, poor motor performance, or bearings that need replacement.
3b. System problems are often caused by the system changing after the pump was selected and installed. These may be caused by new piping or tanks, air blockage, closed or throttled valves, inadequate piping capacity, or inefficient use of storage.
Once the source of the energy problem has been identified, it can be corrected by maintenance/repair, changes in operation, and modified impeller or pump replacement based on a preliminary return on investment for such work.
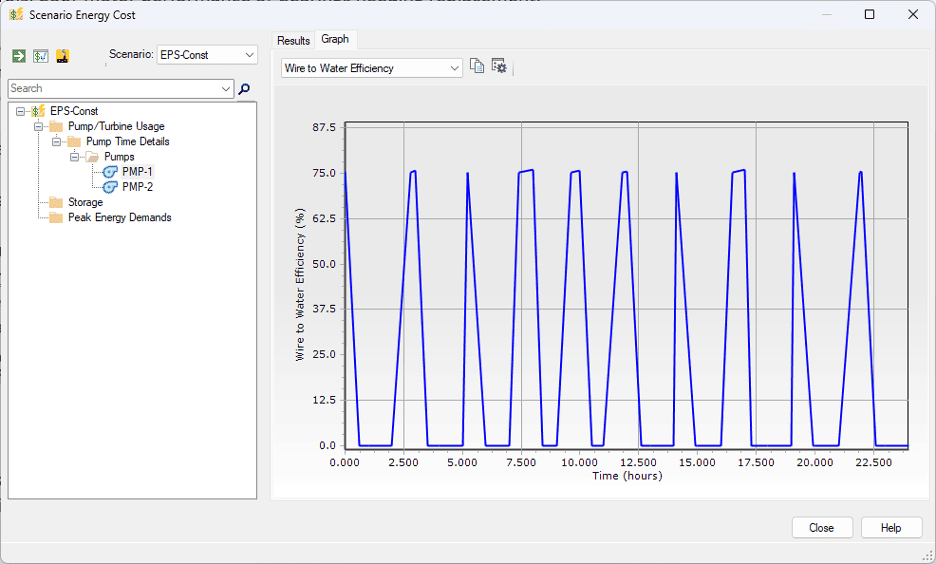
4. Pump selection should begin by updating the hydraulic model with new demand estimates and recent/planned pipes, tanks, and other infrastructure. A range of system head curves should be generated and operating points for new pumps should be determined to maximize efficiency over a range of operating conditions. Decisions as to the use of constant or variable speed pumping can be analyzed at this point based on hydraulic analysis of alternatives. New pumps should be selected based on life cycle costs. Pick Analysis > Energy Costs > Scenario Energy Costs. Here’s a typical output for wire-to-water efficiency over time.
5. Using actual energy tariffs, energy costs should be calculated for any replacement or system modifications. These should be tested for many demand scenarios and different operating strategies. Be sure to consider peak demand charges.
6. Future energy bills can be calculated for system/pump modifications. If no major actions are required, the current energy bill needs to be reviewed and reconciled with expected costs based on hydraulic analysis.
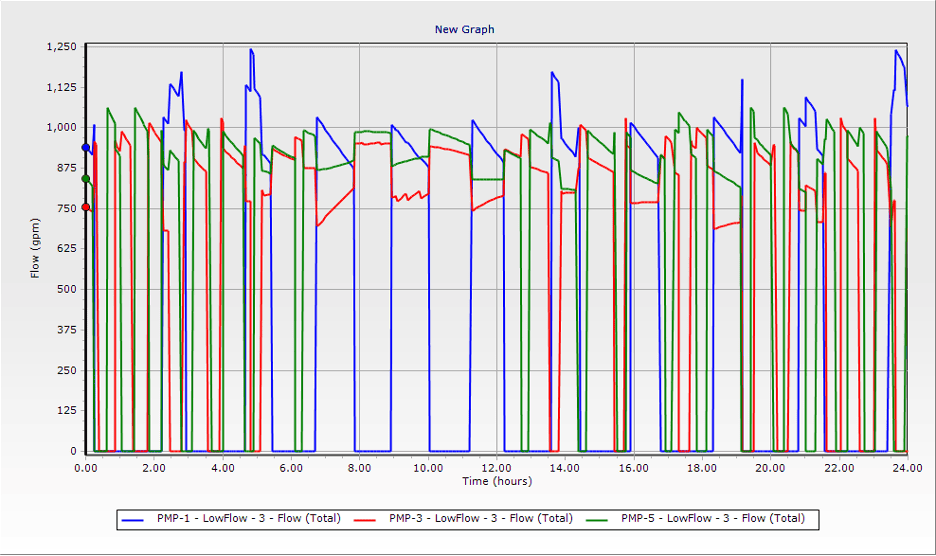
7. Any modifications to the system need to be reviewed by system operators. Guidance to system operations needs to be updated and should cover emergencies and unusual events, as well as typical operations. Simulate different conditions to check how pump operations will vary. The graph below shows flow in each pump in a manifold force main with three pump stations over time.
This isn’t the only way you can conduct this type of pump energy study, but it gives a person a path through the many things that can be done to save energy (and money). Having a work plan avoids problems that can occur by deciding to replace a pump without understanding that there is a closed valve next to the station, or trying to optimize pump starts/stops for pumps that don’t adequately match the system any longer and need to be replaced.
Please send any comments or questions to [email protected].
If you want to contact me (Tom), you can email [email protected].