Bentley Insights: What went wrong last week?
Otto Lynch: The safety code divides the country into several loading districts—basically, how much weight from ice and wind the power lines need to handle. Some of those maps date back to 1918. All of Tennessee and Arkansas, and parts of Mississippi and Louisiana, are in a district that only requires overhead power distribution lines to withstand a quarter inch of ice. Last week, they got up to an inch. The overhead power distribution line infrastructure simply wasn’t designed for it.
BI: What can software do about that?
OL: We can model the entire grid and stress-test it against any weather scenario you want. While we were on this call, I ran a structural analysis on about 70 miles of lattice steel transmission line. It took a few minutes. The line was originally designed for 1” of ice, but I changed the ice thickness from one inch to two inches, and the software instantly showed which structures would fail – and where – showing red blobs on a heat map. You know exactly where to send crews and what size replacement poles and components to bring.
BI: How does it work?
OL: We build a digital twin of every structure on the line; the towers and poles and their components and the wires. PLS knows the pole class, the cross arms, the insulators, the wire diameter, everything. It also knows the physics—how much load each component can handle, how wires tighten when temperatures drop, how they sag when it gets hot, how they blow out when the wind blows, and how they droop when they get loaded with ice. You plug in a weather scenario, and it runs the engineering on every single structure.
BI: How granular does the analysis get?
OL: Very granular. I can look at an individual tower and see exactly which members are overstressed. Just now I pulled up a one-and-a-halfinch ice scenario that pushed a structure to 158 percent of its capacity. The software color-coded the problem—the hanger arms holding the wires were too small for this additional ice. Everything else on the tower was fine. The fix would be swapping out four steel members, going from a 2×2 inch steel angle to a 3×3 inch. That’s not a massive capital project. That’s a bucket truck and a crew for a day to do many towers.
The point is you’re not guessing. You’re not replacing entire structures when only a few components need upgrading. And you’re not waiting for the next storm to find out where your problems are. The savings doing this proactive analysis are huge. It is true value-engineering, especially considering that extended power outages are life-threatening, and they’re also huge economic disruptors.
BI: You are talking about asset analytics and predictive maintenance for the grid.
OL: Exactly. And there are two pieces to this: reliability and resilience. In our industry, those words mean something specific. Reliability means the lines don’t fall down in the first place. Resilience means you recover quickly when they do.
If I know a storm is coming next week, I can run that scenario against my entire grid and get a list of vulnerable structures. If I don’t have the time to fix them before the storm, I can pre-position materials—poles, cross arms, tower parts, hardware—near the sites most likely to fail. I can have crews ready to roll. And when I do replace a pole, I can put up a stronger one instead of the same undersized pole that just snapped. That’s reliability and resilience working together.
Think about how airlines do predictive maintenance on jet engines. They don’t wait for something to break at 30,000 feet. They monitor performance, model wear patterns, and schedule maintenance at the best time, before an issue forces them to put a plane out of service and cancel a flight. The grid can work the same way. The physics are well understood. The modeling tools exist. It’s just a matter of applying them.
BI: What’s the bottleneck?
OL: Building the models. That’s always been the hard part. Transmission lines are engineered from the start, so the models mostly exist. But distribution—the local lines running to homes and businesses—has historically been built without detailed engineering. Crews put a standard pole in the ground every 300 feet and call it done. There’s no model to stress-test because no one ever built one.
The modeling itself isn’t difficult. In our PLS-CADD software, you click, pick your pole class, drag in a pre-built template, place the insulators, match it to LIDAR data. A technician can do a pole in less than an hour. But a utility with two million poles is looking at two million hours of work. That’s why most distribution systems have never been fully modeled.
BI: Can AI change that?
OL: We’re not there yet, but that’s where things get interesting. Bentley recently acquired Talon Aerolytics, which tackles this problem. Talon has already flown over 900,000 distribution poles in California. Their software uses machine learning to identify every component in the imagery, including poles, cross arms, insulators, wires, transformers. It figures out what’s there and where it sits on the structure.
BI: How does that connect to the grid analytics?
OL: We think we can take that drone data and automatically generate PLS models at massive scale. Instead of one structure per hour, we’re talking potentially hundreds of structures per hour. The drone captures what’s out there. The AI interprets it. The software builds the engineering model. Then you run the same stress tests on distribution that we’ve run on transmission.
We’re still validating the workflow, so I don’t want to overstate where we are. But the direction is clear. The bottleneck—building models of infrastructure that’s already in the field—is starting to break. And once you have those models, you can test millions of poles against any storm scenario and know exactly where your vulnerabilities are before the weather arrives.
BI: Is there a fix coming for the old standards themselves?
OL: Yes, it is. I’m vice chair of a commmittee working on a new engineering-based overhead power line loadings standard that’s being developed by the American Society of Civil Engineers. It will apply modern, science-based weather data – wind, ice, and temperatures – to all overhead power lines—not just tall transmission structures, but distribution poles too. We expect it to be published this year.
The current NESC safety code by the Institute of Electrical and Electronics Engineers has a loophole: structures under 60 feet don’t have to meet the extreme weather requirements. That exempts most distribution lines. The new standard closes that gap. Once it’s adopted, utilities will be able to engineer their local lines to the same rigor as their long-haul transmission.
BI: What should grid operators take away from this?
OL: We have the technology to build a digital twin of the entire overhead electric power grid. We can then identify every structural weak point on a grid before the next storm hits. We can simulate ice storms, hurricanes, Santa Ana winds, derechos —whatever scenario you might reasonably expect to have—and get back a prioritized list of the structures and individual components that need attention.
The tools exist to make this grid reliable. The question is whether the industry commits to using them. In addition to the utilities themselves paying out of their own pocket, FEMA, other government agencies, and insurance companies often pay to rebuild failed infrastructure after every major storm. Utilities often replace the broken poles with the same class of pole that just failed. The cycle repeats.
It doesn’t have to. We can model what’s out there, find the vulnerabilities, and fix them before the next ice storm or wildfire or hurricane. Or we can know what to fix them with after the next event causes those failures. The software runs in minutes. The upgrades are often straightforward. The alternative is what we saw in late January.

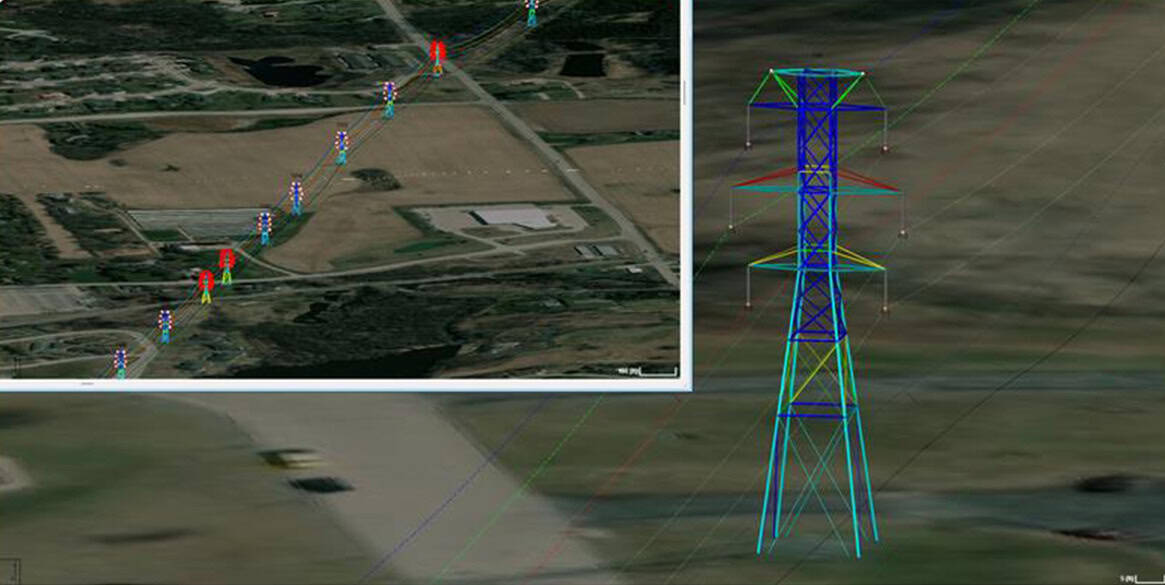
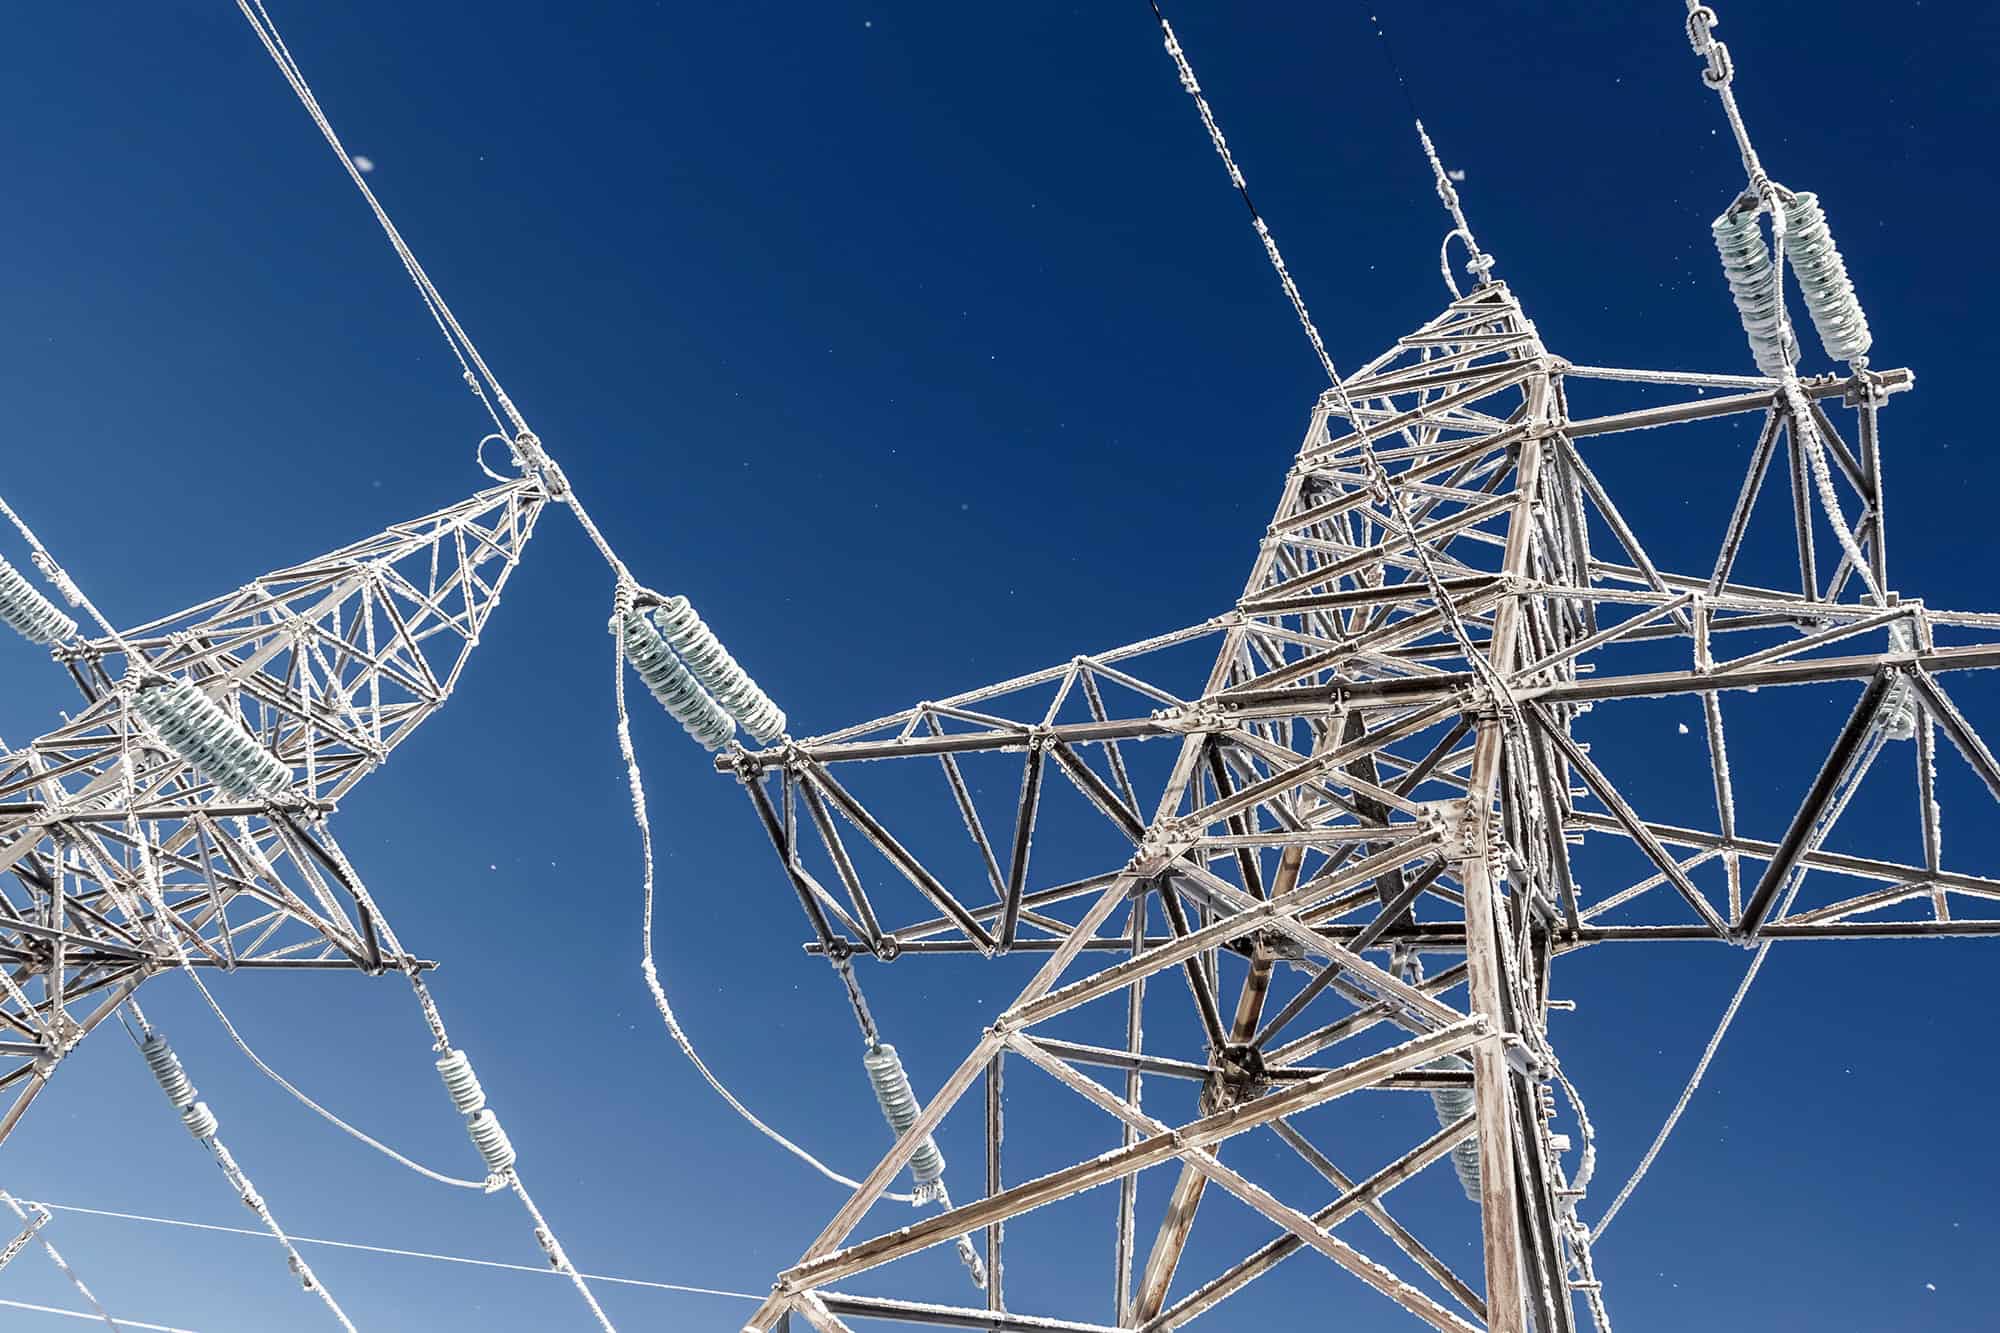 Software can model and stress-test every pole, crossarm, and wire on the grid, simulate any windstorm and ice cover, and identifying which structures are likely to fail.