Work on the upcoming AWWA Manual on Energy (M83) is wrapping up, and I’ve been working with Eric Dole, National Water and Energy Practice Lead for Garver, on the pumping chapter. It’s shaping up nicely. One topic that has come up is: What’s the best metric for judging if a pump or a pump station is working well vs. one that is wasting energy and money?
There are quite a few potential metrics, and they all have their strengths. The definitions vary, but the most common are:
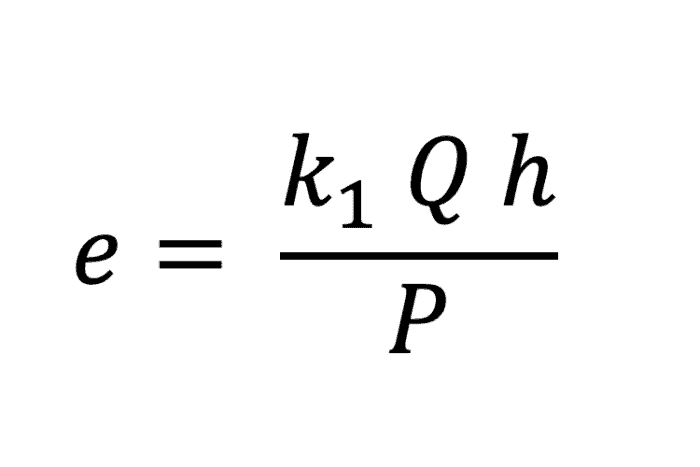
Efficiency
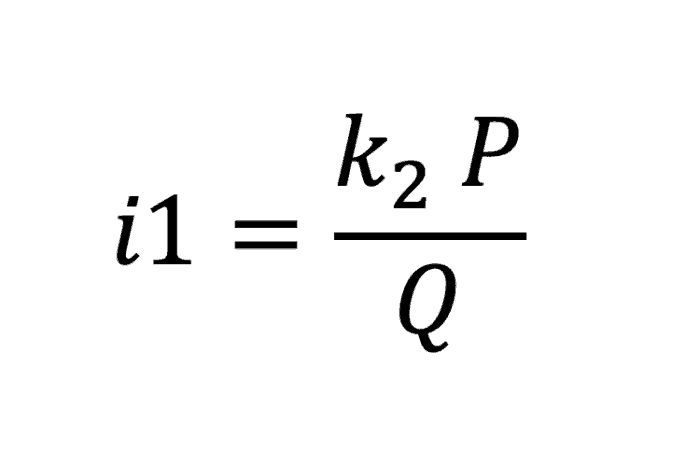
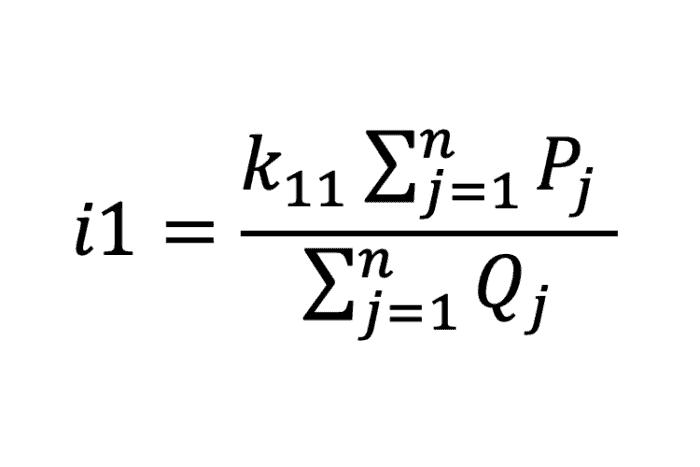
Energy intensity
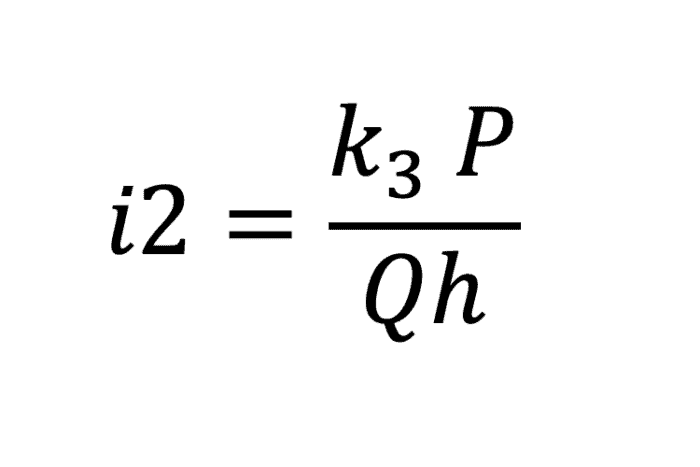
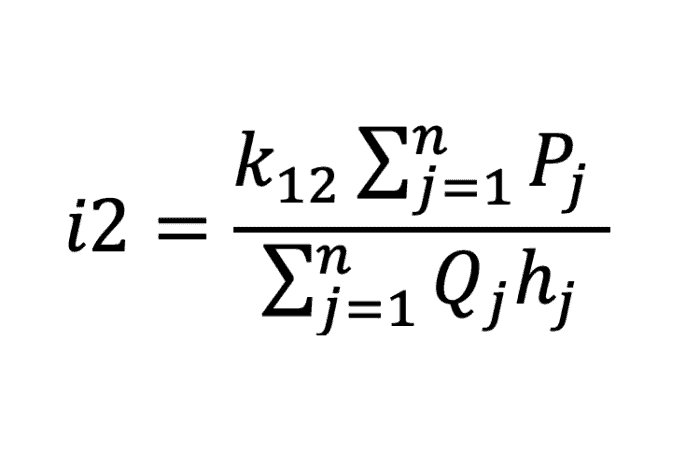
Or, in some cases:
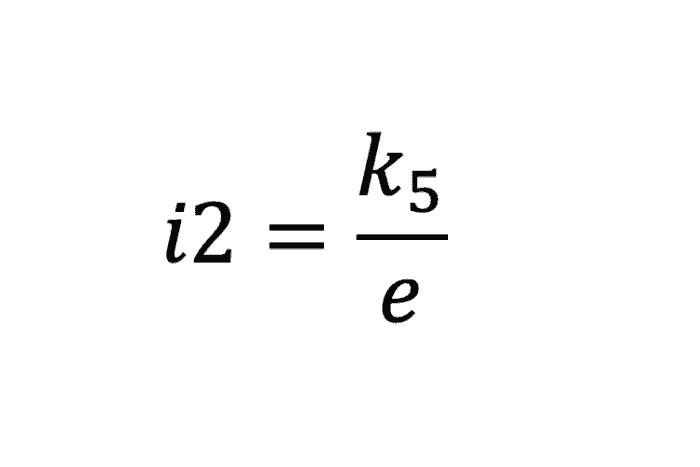
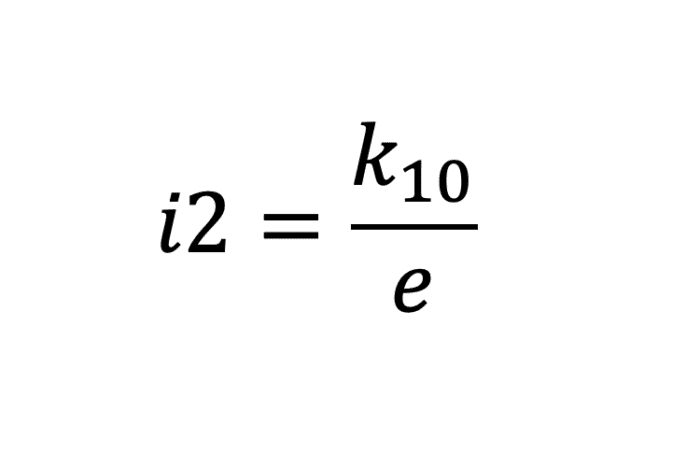
Where e = efficiency, Q = flow, h = pump head, P = power, i1 and i2 are two different formulations for energy intensity, and the k values are unit conversion factors that depend on the units used.
Efficiency can either be pump efficiency or wire-to-water efficiency. For pump comparison, it is best to use wire-to-water efficiency because it accounts for motor and drive efficiency.
We can solve these equations simultaneously to give:

Essentially, energy intensity is just the inverse of efficiency. Efficient pumps have a low energy intensity. The difference between i1 and i2 is that i1 has a worse intensity for pumps discharging into a higher pressure zone, while i2 looks at the pump efficiency independent of the head. I could make a strong case for either being a better metric, but my preference is efficiency.
For one thing, efficiency is dimensionless. For example, 70% efficiency is the same in English or metric units, whether you measure flow in MGD, cfs, gpm, Lps, or cubic furlongs per fortnight. Second, we all have an idea of what 70% means, while 20 kw/gpm only means something to those who have been working with these units for a long time but may need to switch to another set of numbers for a different water system. It’s hard to compare energy intensity between pump stations.
What I’ve discussed above has meaning for instantaneous efficiency or energy intensity. However, engineers and operators are usually more interested in efficiency or energy intensity over a time period, such as a day, a billing period, or annually. This is based on the total volume pumped and energy used during a time period.
That means that the earlier equation needs to be rewritten as:
Efficiency during time period
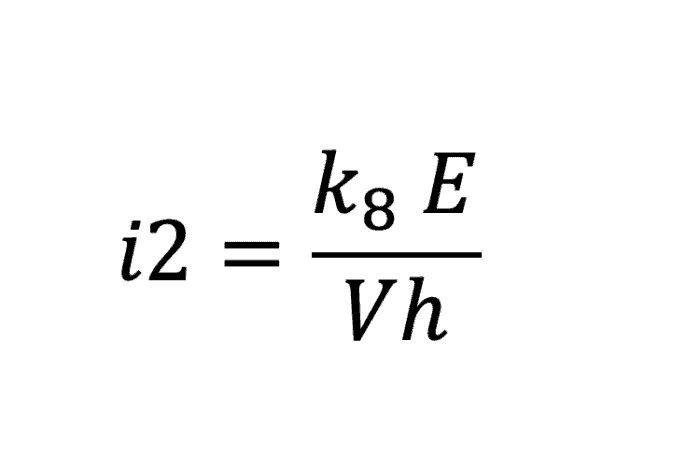
Energy intensity during time period
Where in this case, e = average efficiency, h = average head, and E = total energy used.
Once again, energy intensity is just the inverse of efficiency with different units.
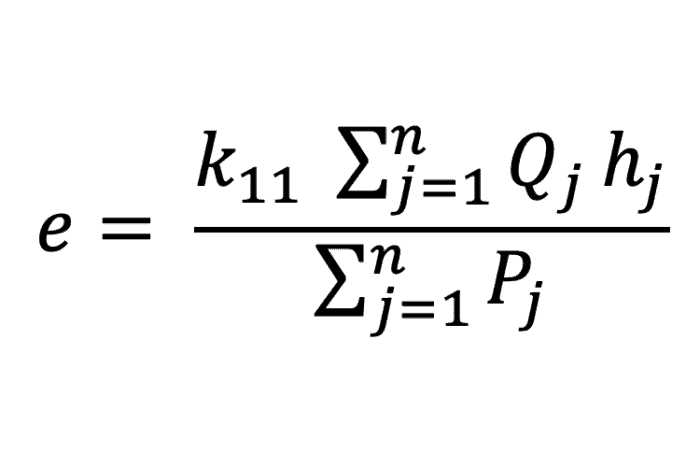
So far, we’ve talked about the metrics for individual pumps. For those wanting to determine a pump metric for a pump station, a pressure zone, or system-wide, it is tempting to simply average the efficiency or energy intensity of the individual pumps. That would be incorrect because pumps with high head or flow have a higher impact on the average and pumps that run almost 24/7 have more impact than those that are seldom operated.
For efficiency, this results in an efficiency of
And for energy intensity
Where j refers to the j-th pump out of n.
But what about “specific energy,” which gets used sometimes in place of energy intensity?
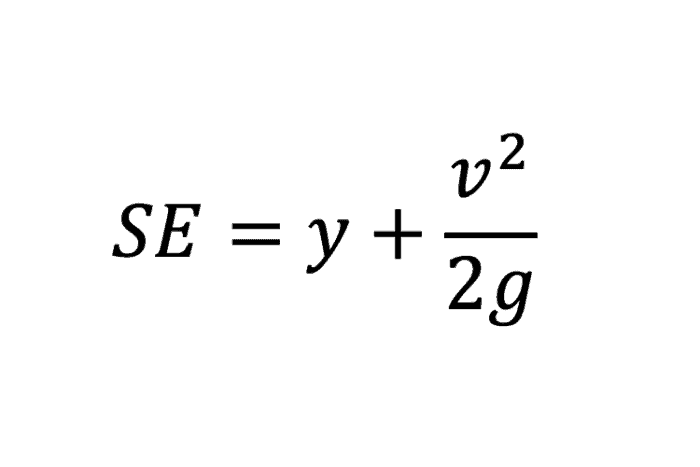
While it might be a good name for a consulting company, it is easy to get it confused with the term “specific energy” that has been used in hydraulics for centuries in open channel flow. It is defined as:
Where SE = specific energy, y = depth of flow, v = velocity, and g = gravitational acceleration.
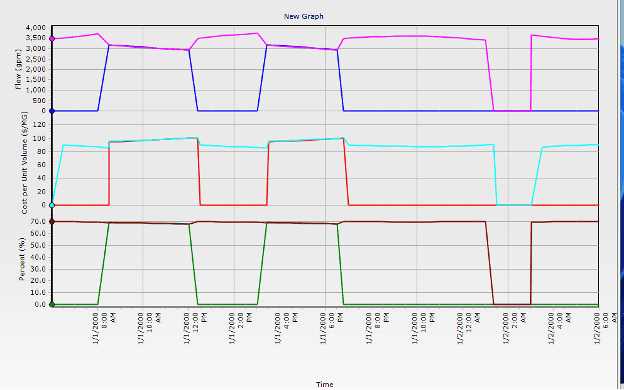
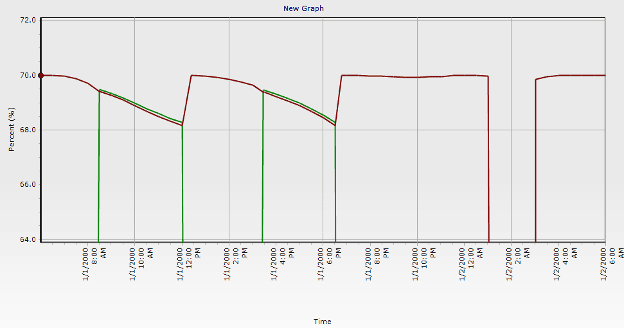
Bentley’s OpenFlows WaterGEMS can calculate efficiency or a monetized version of energy intensity (i1), what WaterGEMS refers to as the “cost per unit volume.” This is useful for evaluating a single pump, but looking at the pumps at a pump station can give some real insights as shown in the graph below. (It’s possible to view multiple results on a single graph.)
In the illustration, there are two pumps―the magenta pump, which runs virtually all the time, and a blue pump that turns on several times a day to maintain tank levels. When one pump runs (magenta), the efficiency is 70%, and the cost per unit volume is $87 to $89 per MG. However, when a second equivalent pump turns on, the combined efficiency drops to 68%, and the cost per MG increases to $99 to $101. These small savings can easily be overlooked by an operator, but WaterGEMS can point out the potential savings.
When the cost for a unit of energy is constant, it is easy to convert Kwhr/MG to $/MG, but WaterGEMS can also perform the calculations even when complications such as time-of-day pricing are involved.
With WaterGEMS graphing, it is also possible to zoom in and see the change in efficiency even when it may be a few percent, which can add up over a year.
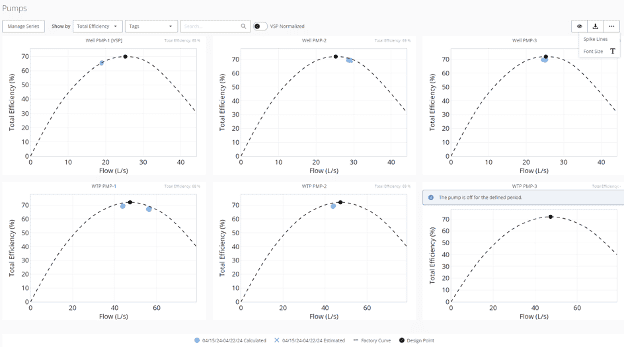
In Bentley’s OpenFlows WaterSight, we enable the user to track actual pump efficiency in any time period. Here are some examples with the blue points showing the efficiency calculated with SCADA data compared with the expected efficiency curve and best efficiency point. An operator gets good feedback when a pump is running inefficiently. The efficiency WaterSight displays is called “Total Efficiency,” although I think “Wire-to-Water Efficiency” is even less ambiguous, at least in the U.S.
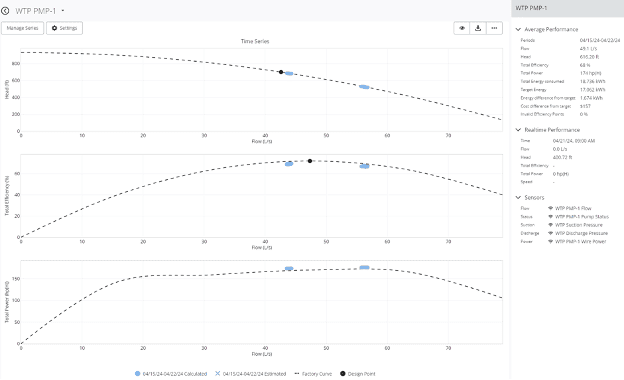
It’s also possible to zoom in on one pump and view head, power, and efficiency data on the same screen. Notice that in this case, the pump operates at one point when it runs by itself and another when it runs with another pump in the station.
So, what’s the answer to the question and the title of this blog?
In my opinion, the best metric for judging pumps is “efficiency.” It’s universally understood as the ratio of power out to power in; it is dimensionless (it means the same thing in any unit system); and pretty much everybody knows that it means the same thing if it is calculated for a single pump at a single point in time, a single pump over time, or a collection of pumps.
Read more of Tom’s blogs here, and you can contact him at [email protected].
Want to learn more from our resident water and wastewater expert? Join the Dr. Tom Walski Newsletter today!

