Choose Area of Interest
SEARCH SOFTWARE
by Paul Rotter
The infrastructure industry stands at a transformational crossroad. For the first time in the history of civil engineering, we’re witnessing a technological shift so profound that it rivals the introduction of CAD itself. Artificial intelligence (AI) isn’t just another software...
by Maria Lamas-Gomez
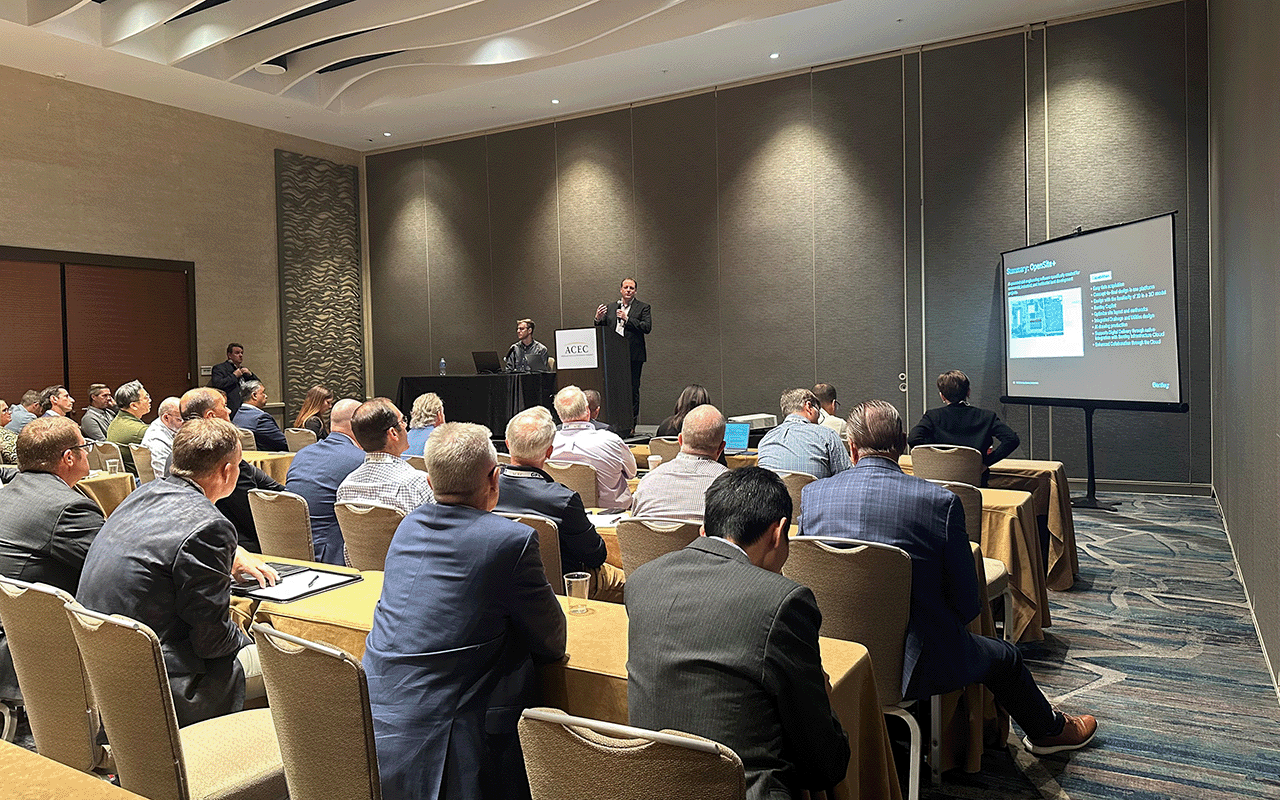
The ACEC Fall Conference is always a highlight for civil engineering professionals across the industry, and this year was no exception. It serves as a launchpad for the future of civil engineering with many conference sessions centered around innovation and...
by Kelly Ramesar
by Eleanore Nguyen-Locke

by Steven Fruhwirth
In the world of bridge engineering, project complexity is always increasing. Meeting tight deadlines and ensuring model accuracy requires software that can handle advanced modeling and analysis without creating disconnected workflows. That’s why we are excited to announce the general...
by Oana Crisan
When you picture a site engineer at work, you might envision someone hunched over site plans, crunching numbers, or navigating a tangle of regulations and red tape. For VHB’s Brianne Belschner, model-based design lead, and Adam Smith, assistant director of...
by Kelly Ramesar
How one engineer’s MicroStation® passion sparked a career in training In college, Scott Urbas took a computer aided drafting class that taught MicroStation and became an instant fan. He continued to learn everything he could about CAD while getting his...

by Jena Shore
The latest U.S. Census Value of Construction Put in Place Survey reveals new insights into the powerful trend of where infrastructure investment is surging, including design and construction. As of July 2025 alone, the top three project classification types include:...
by Maria Lamas-Gomez

