I’ve read a lot of papers about water loss reduction. Two concepts that show up frequently are Minimum Nighttime Flow (MNF) and District Metered Areas (DMA). DMAs are areas in the distribution system that can be isolated such that all system inflows and outflows (not including customer use) are metered. They are helpful in identifying areas where leakage is prevalent. Most of the time, leakage is a small fraction flow, and it is difficult to identify a small/medium leak in a DMA. For example, recognizing a 10 gpm leak in a DMA with a 200 gpm average flow is easier than finding one when the demand is 20,0000 gpm. However, in the middle of the night, water use in DMAs decreases and leakage becomes a more easily identifiable portion of the flow. The flow at this time is referred to as the MNF and it is usually measured at an hour somewhere between 1 a.m. and 5 a.m. If the MNF is less than or about 50% of the average daily flow, that DMA is not considered a likely source of major leakage. If it is higher and if it changes fairly suddenly, that’s a good place to look for new leaks.
With the advent of big data, MNF and DMAs are getting a good bit of emphasis both in practice and research. However some research papers imply that these concepts are of recent origin. In one research paper I recently read, the oldest reference was from 2014. I remember hearing about MNF and submetering systems when I was a young engineer many years ago (and it wasn’t 2014). I decided to go back to the sources of these concepts.
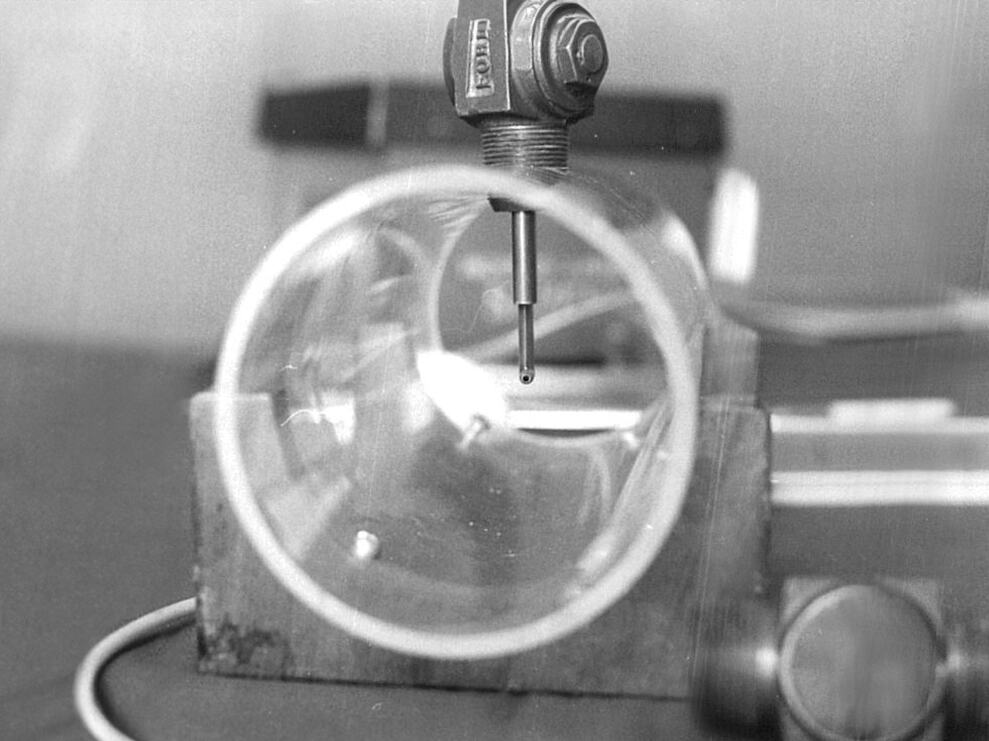
Measuring MNF other than at treatment plants wasn’t practical until John Cole invented a Pitot rod in the late 1800s that could be used to measure flow in pipes through a tap fitting. With the Cole Pitometer, a water utility could excavate to access a pipe, tap it, and insert the Pitot rod to measure flow. This made it possible to measure flow in any pipe in the distribution system. Cole started a company, Pitometer Associates, that conducted flow studies for many water utilities. They developed a reputation for excellent work, and if you walked into pretty much any water utility’s office, you’d see a few Pitometer Associates reports on the shelf.
Along the way, they developed the idea of using MNF for DMAs as a key indicator for leakage. I asked Jeff Cruickshank, who is probably the last Pitometer Associate employee still working and is now an associate VP for Hazen & Sawyer, when he thought Pitometer developed this approach relying on MNF, and he estimated “100 years ago.” So, MNF has been with us for a while. Between Jeff and me, we dug up a few papers including Pitometer (1950), Cole and Queneau (1970), Cole (1970), and Siedler (1985). The Cole in these papers was E. Shaw Cole, the grandson of John Cole, but we think the application of MNF to these studies preceded the papers by some time. As a young engineer, I remember running into Mo Siedler at various conferences and he always had some good stories to tell.
What does MNF look like today? The big difference from earlier times is the ease with which data can be collected and analyzed thanks to modern SCADA, IoT, and digital twin technology. Bentley’s digital twin for water distribution, OpenFlows WaterSight, has some nice workflows to automatically import flow meter data and serve it up to identify likely leak areas and drive response.
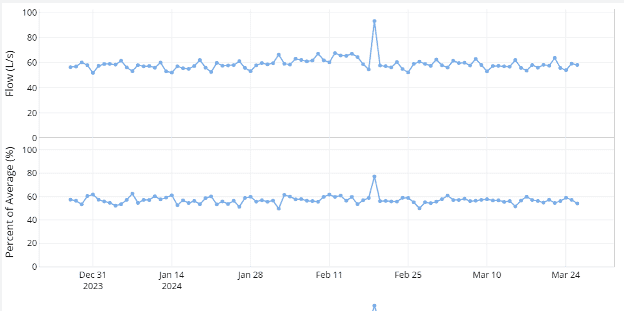
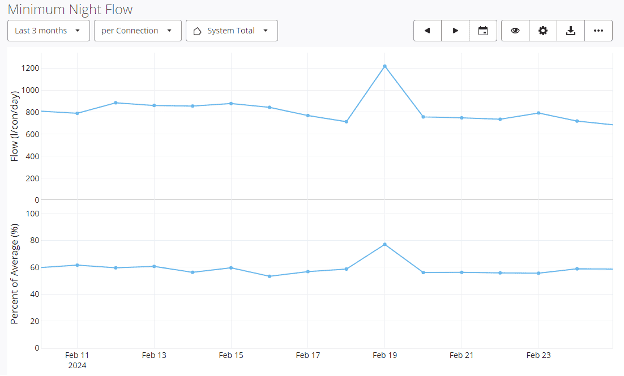
Here is a WaterSight graph of MNF and Percent of Average, which is also referred to as minimum nighttime ratio (MNR). A MNR is a valuable indicator of leakage. For a typical residential and light commercial area, it should be lower than 0.4 (40%) or 0.5 (50%). Most people are asleep when MNF occurs, so leaks are a larger fraction of the flow.
While the above graph shows a MNF for a three-month period, it may be desirable to zoom into a smaller time scale and find that the unusual MNF corresponded to 19 Feb., which most likely will correlate with a known break.
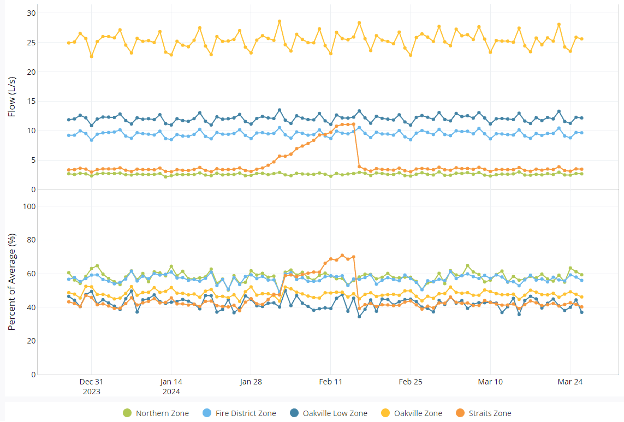
The real power of course, is detecting the break before water surfaces and complaints roll in. WaterSight can alert utility staff to the beginning of an upward trend. But even more valuable is the ability to spatially locate the break. In the figure below, the line for the Straits Zone shows a significant increase in flow (orange line) and would direct crews as to where to look for a significant new leak. In that DMA, the MNF increases from 3 to 12 L/s, which might go unnoticed if not for the DMAs.
Large industrial or irrigation water users can require that a deeper understanding of their water flow data may be needed before applying rules of thumb for MNR. It may be necessary to subtract these large users, or at least understand and allow for what may be a very high average flow.
Especially in areas where individuals are not metered or not billed by volume, some of the leakage may not be distribution system leakage but a leakage in customer plumbing which will elevate the MNF.
Armed with MNF data, DMAs, and WaterSight, water utilities have a useful and relatively easy tool to help in their battle with water loss. But DMAs and MNF are not new.
Cole, E.S. and Queneau, R.B., 1970, “Assessing the Adequacy of a Water Distribution Network,” Water Supply and Sanitation seminar, Bangkok, Thailand.
Cole, E.S., 1979, “Methods of Leak Detection,” Journal AWWA, Feb., P. 73.
Pitometer, 1950, “Report on Pitometer Water Waste Survey, Charlotte, NC,” The Pitometer Company, New York.
Siedler, Moses, 1985, “Winning the War Against Unaccounted-for Water,” New England Water Works Association, Vol. XCIX, No. 2, p. 119, June 1985
Learn more about Bentley’s water, wastewater, and stormwater solutions.

