Isolation valves are essential components of water distribution systems. Without them, repairing a pipe break or performing other maintenance would require shutting down the entire water distribution system or resorting to some heroic work on pressurized pipes.
But how many isolation valves are needed? They are not inexpensive, and they require occasional maintenance. Installing too many valves can be a waste of money, while too few valves result in an unreliable system with frequent service interruptions. Ideally isolation valves in a distribution system would enable a shutdown to be isolated to a single city block.
In the US, the “correct” number of valves is given in Ten State Standards (GLUMB, 1992) as:
“Sufficient valves shall be provided on water mains so that inconvenience and sanitary hazards will be minimized during repairs. Valves should be located at no more than 500-foot (152 m) intervals in commercial districts and at not more than one block or 800-foot (244 m) intervals in other districts. Where systems serve widely scattered customers and where future development is not expected, valve spacing shall not exceed one mile (1609 m).”
Because the criteria for spacing between valves is not the best way to specify valve locations and also is often ignored anyway, I was interested in finding out the “optimal” spacing of valves and the optimal number of valves in a system. About a decade ago, I wrote up a simple optimization based on the tradeoff between valve cost and the value of water that would not be delivered (Walski, 2011).
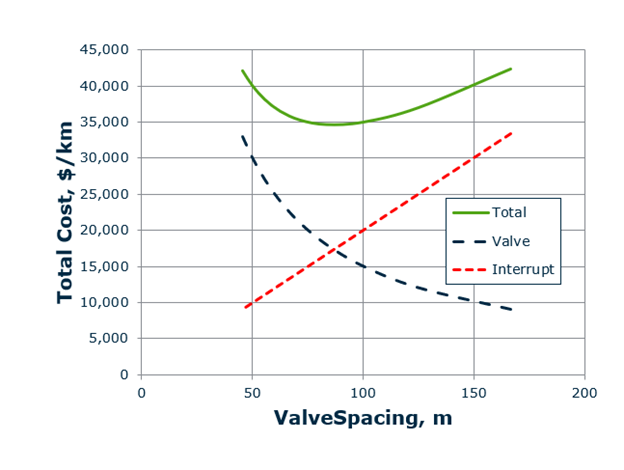
As with most optimization problems, I made a lot of assumptions and used “typical” values for the inputs. Based on the assumptions and typical values, you need to take the results shown below with a grain of salt. Here’s what the results looked like.
Using that approach, the “optimal” spacing of isolation valves was on the order of 250 ft (80 m).
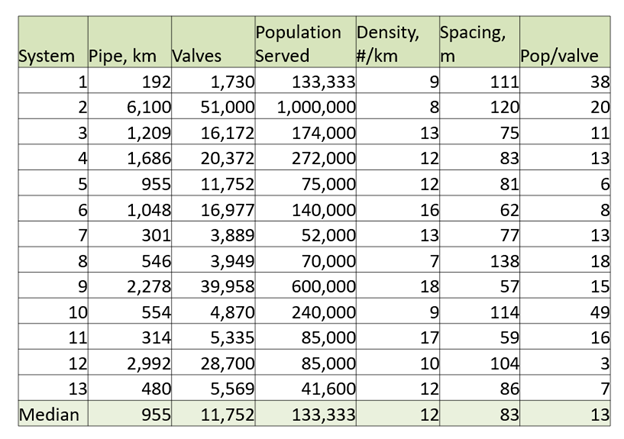
I wanted to validate this result by seeing how existing water systems in developed countries space their valves and tracked down valve and other system information for a wide range of systems. The resulting table is below showing that typical practice was reasonably close to my suggested spacing.
But as I mentioned earlier, valve placement based on spacing is not the best way to locate a valve.
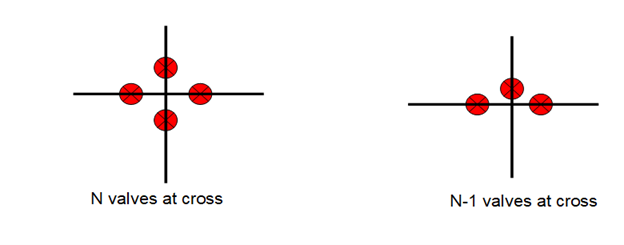
The real action occurs at intersections. If you have four pipes meeting at an intersection, how many of those pipes should have valves. This led to classifying intersections based on whether there are N, N-1, N-2… valves. N valves is the most reliable design, but N-1 makes it possible to do a good job isolating a problem to a single city block. A lower density of valve will enable the influence of a pipe break to spread through the system.
The link-node model of a distribution system is great for hydraulic calculations. However, it doesn’t capture the topology of the system in terms of shutdowns. Shutting down a portion of a distribution system does not shut down a link (although sometimes it’s not too bad). There is no such thing as an isolation valve at a junction of pipes.
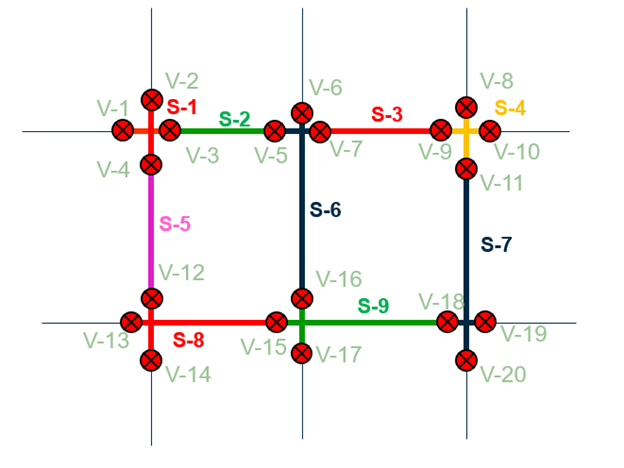
Isolation valves are located along pipes. Removing a pipe link from a distribution model is not the same thing as doing a shutdown. To adequately represent a shutdown, it is necessary to think of a distribution system made up of a bunch of distribution system “segments” connected by valves. I defined a segment as the smallest portion of a distribution system that can be isolated by valves (Walski, 1993).
While the pipe network in the GIS or hydraulic model may look like this with the segments shown in different colors, displaying the segments provides more information.
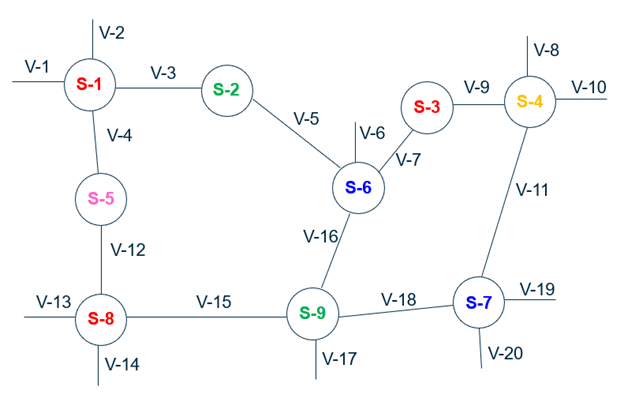
The segment–valve view (below) shows segments as circles, and valves as links.
Most engineers are not familiar with the segment-valve topology, so in OpenFlows WaterGEMS, we use color coding to indicate segments as shown below. In the example, the pump station on the right side of the figure appears to be fed by three pipes in the link-node model. However, because there is not a valve at the end of P-24, a break at the green arrow will shut down the magenta segment and cut off all flow to the pump station.
Once segments are automatically identified, the criticality analysis in OpenFlows WaterGEMS can simulate shutting down each segment individually and determine the number of valves that must be shut to isolate a segment, the number of customers out of water, and the shortfall in water delivered. This enables the engineer or operator to identify locations where an additional valve can dramatically reduce the adverse impact of a shutdown.
The figure below shows every customer that will be out of water in each segment.
In a follow up paper, we were able to automatically generate the segment–valve diagram with the segment number placed and the centroid of each segment. In this figure, the segment is color coded by vulnerability (Abdel-Motaleb and Walski, 2021), where figure segment 15 is the magenta segment from the earlier graph. Every segment downstream of 15 has increasing vulnerability.
Use of distribution system segments and criticality analysis in OpenFlows WaterGEMS enables the user to make more informed decisions on valve number and placement.
Abdel-Motaleb, N. and Walski, T., 2021, “Evaluating Segment and Valve Importance and Vulnerability.” JWRPM, 147(5), 04021020.
GLUMB (Great Lakes and Upper Mississippi River Board of State Public Health & Environmental Managers) (1992) “Recommended Standards for Water Works,” Albany, NY.
Walski, T.M., 1993, “Water Distribution Valve Topology,” Reliability Engineering and System
Safety, Vol. 42, No. 1, p. 21.
Walski, T., 2011, “How Many Isolation Valves are Needed in a Water Distribution
System?”, CCWI Conference, Exeter, UK.
If you want to look up past blogs, go to https://blog.bentley.com/category/hydraulics-and-hydrology/. And if you want to contact me (Tom), you can email [email protected].
Want to learn more from our resident water and wastewater expert? Join the Dr. Tom Walski Newsletter today!


