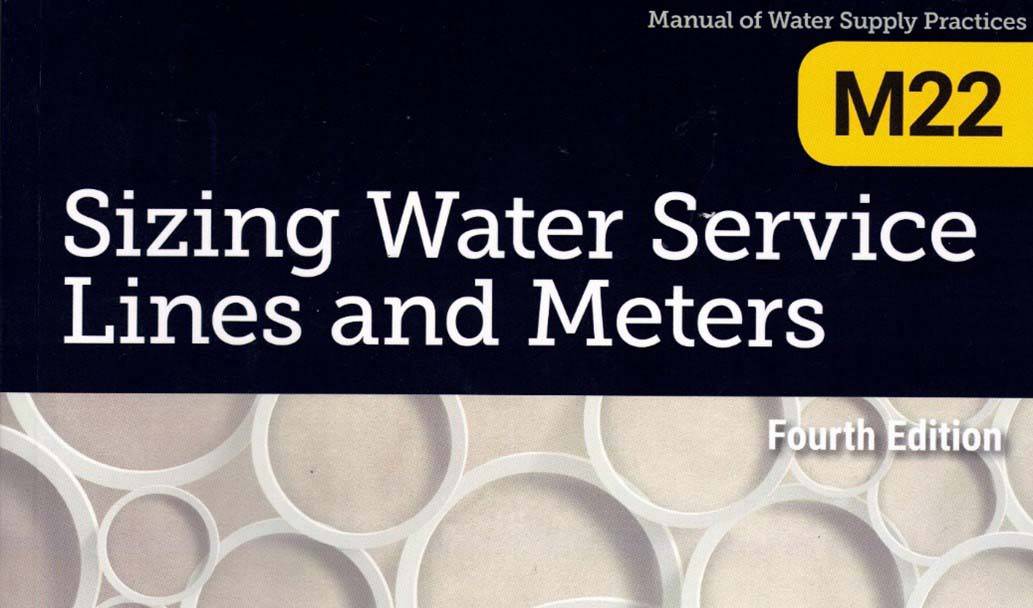
AWWA recently announced the release of the fourth edition of its popular manual, M22-Sizing Service Lines and Meters. You might be thinking, “What could be new in sizing service lines?” For the most part, not much has changed, but there has been a major update to the way that residential peak demand is calculated.
If you only have a single fixture in a building, then the peak demand in the building is the same as for the single fixture. If you have two fixtures, just add the demands. As the number of fixtures increases, however, the chance that all will be running at the same time decreases. This problem was solved nearly a century ago by Roy B. Hunter of the National Bureau of Standards (Hunter 1940, 1941) who developed an expedient method based on the Binomial theorem and flows from typical water fixtures from the 1930s. The result was the widely used Hunter’s Curves that related the peak water demands to the number of fixture units.
The iconic Hunter’s Curve worked so well that it was quickly incorporated into many plumbing codes around the world. Over the years, however, the Hunter’s fixture unit concept has been modified by various groups for various purposes. Indoor water use habits have changed, plus the demands from various fixtures have decreased in response to water conservation. That part of M22 was the part that could use some editing.
Hunter’s Curves looked like this:
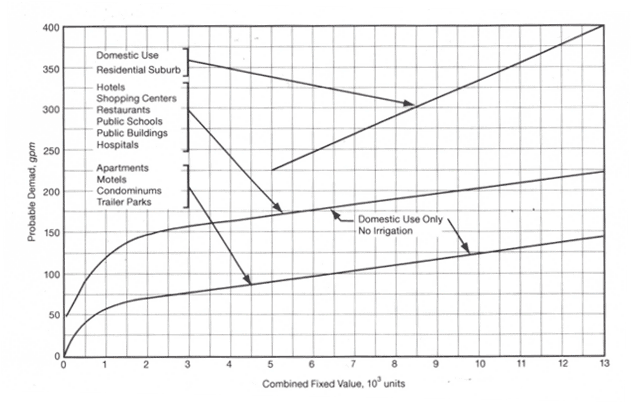
But you won’t find encouragement to use Hunter’s Curves in the fourth edition of the manual. After a century of work, M22 is retiring the curves and replacing them with a new procedure.
The new method is similarly based on the flow from a fixture and the probable number of fixtures that will be running at the peak hour. But unlike Hunter’s work, today’s authors of M22 have computers that enable them to determine peak flows while accounting for a wider range of conditions. It also preserves the supposition that pipe and meter sizing should be based on a flow that will not be exceeded with a 99% probability.
At the low end of the number of fixtures, it is feasible with computer calculations to enumerate every possible combination of fixtures to accurately determine the 99% flow. But even with computers, as the number of fixtures increases, enumeration becomes very cumbersome, even if theoretically possible.
In 1995, Robert Wistort used a normal distribution approximation to Hunter’s binomial approach to estimate peak demands when the number of fixtures is very large.
The shortcoming of Wistort’s method was the built-in assumption that there is no time when the flow is zero. This is a reasonable assumption when the building contains a very large number of fixtures (somebody will be using water at any time) but not for smaller or medium-sized buildings. A task group from the University of Cincinnati and IAPMO (International Association of Plumbing and Mechanical Organizations) solved this problem by developing a Modified Wistort Method which filled in the hole in the demand forecasting picture using a zero truncated binomial distribution (Buchberger et al., 2017 and AWWA, 2024). This development extended Hunter’s original binomial model to smaller buildings based on the condition that at least one fixture was running water. After all, plumbing systems are not sized for a zero-flow condition.
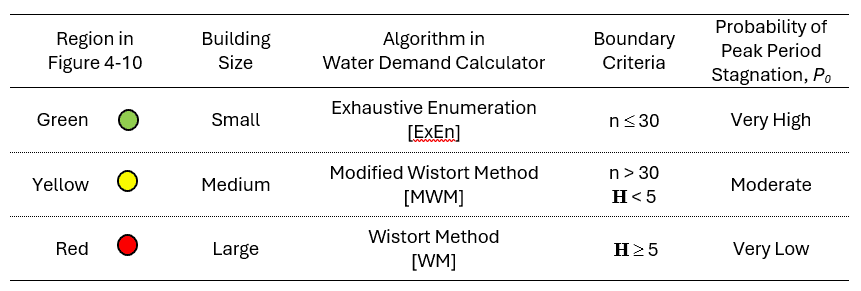
This leaves the M22 team with three ways to calculate peak water demands, all requiring computer calculations.
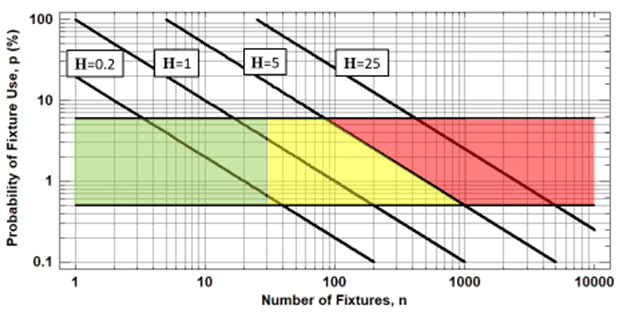
Hydraulic engineers often use dimensionless numbers to characterize a problem, in this case, based on the size of the building. The task group needed a way to classify buildings by a dimensionless number, so they came up with the Hunter Number defined as:
H = n p
Where H is the dimensionless Hunter number, n is the total number of fixtures in the building and p is the probability that an individual fixture is operating during the peak period. From a physical standpoint, the Hunter number represents the average number of indoor fixtures that are running water at any instant during the peak period (Buchberger et al., 2017).
The task group also identified ranges of H where each of the three methods is applicable.
Notice that in the Hunter number and all three methods, each demand type can have its own probability that a fixture is busy, and flow rate and number of fixtures of that type. This significantly extends the flexibility of Hunter’s original method.
Knowing the number of fixtures of each type and the Hunter Number, an engineer can calculate the peak demand. However, most engineers would rather not crank through all that math, which can get to be a bit heavy. So, the M22 team (Mayer et al., 2020; Omaghomi, et al., 2020) developed an easy-to-use spreadsheet program to determine the flow. It’s referred to as the “Water Demand Calculator” (WDC) and has been incorporated into the International Association of Plumbing and Mechanical Organization (IAPMO’s) Uniform Plumbing Code. It can be downloaded at
https://www.iapmo.com/water-demand-calculator.
The WDC is Excel-based and who can’t run Excel these days?
The range of application of the three methods is illustrated by the figure below, excerpted from the new M22 manual, fourth edition (AWWA, 2024).
Another innovation in the fourth edition is that the flows from each type of fixture are lower because modern fixtures are set to work with lower flow such as low-flow showerheads.
The peak flow from M22 isn’t the final answer, however, as fire sprinkler demands, external irrigation, and other demands need to be added in, but the Water Demand Calculator should get engineers over the hurdle of residential demand forecasting.
The new M22 method was verified in field studies of peak water use at large residential buildings in the United States and Australia.
In early applications, this new approach has generated lower peak demand estimates than traditional methods for selecting water meters or sizing service lines. This reduction will have a long-term effect on right-sizing meters by not being over-conservative, yet still capturing flow accurately as smaller meters are better at measuring lower flows.
References
American Water Works Association (2024) Sizing Water Service Lines and Meters, M22-Manual of Water Supply Practices, fourth edition, edited by P. Mayer, AWWA, Denver, CO.
Buchberger, S., Omaghomi, T., Wolfe, T., Hewitt, J., and Cole, D. (2017) “Peak Water Demand Study – Probability Estimates for Efficient Fixtures in Single and Multi-Family Residential Buildings” Executive Summary, Ontario, CA IAPMO.
Hunter, R. (1940) BMS-65, Methods of Estimating Loads in Plumbing Systems, National Bureau of Standards, Wash, D.C.
Hunter, R. (1941) BMS-79, Water Distributing Systems for Buildings, US GPO, Wash, D.C.
Mayer, P. S. Davis, S. Buchberger, and C. Douglas (2020) “Assessing Water Demand Patterns to Improve Sizing of Water Meters and Service Lines,” WRF Report 4689, Denver, CO.
Omaghomi, T., S.G. Buchberger, D. Cole, J. Hewitt, and T. Wolfe (2020) Probability of Water Fixture Use During Peak Hour in Residential Buildings, ASCE Journal of Water Resources Planning and Management.
Wistort, R.A. (1995) “A New Look at Determining Water Demands in Buildings: ASPE Direct Analytic Method,” Proceedings American Society of Plumbing Engineers Convention, Kansas City, MO, 17-34.
Read more of Tom’s blogs here, and you can contact him at [email protected].
Want to learn more from our resident water and wastewater expert? Join the Dr. Tom Walski Newsletter today!

