Clarity is invaluable for a project as staggeringly complex as the international fusion experiment. The project, also known as the International Thermonuclear Experimental Reactor (ITER), is being built in France and is one of the most ambitious scientific collaborations in history—in the same league as the and the International Space Station. Dubbed the “reverse Tower of Babel,” it brings together 35 nations to prove that fusion energy can be a practical and effectively limitless source of carbon-free energy.
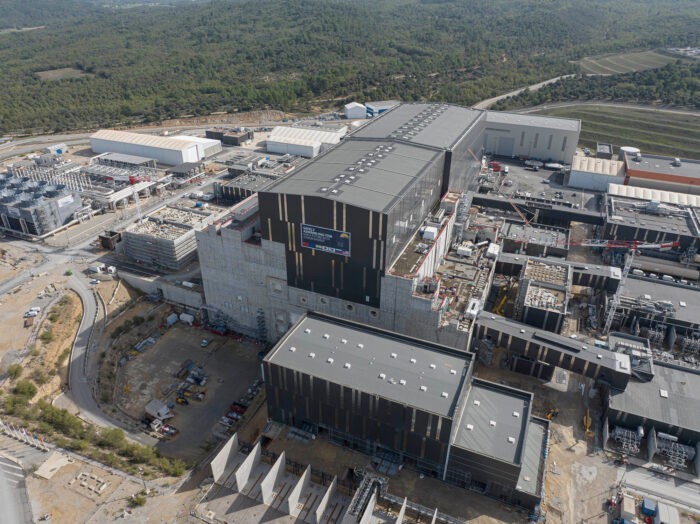 Aerial view of the International Thermonuclear Experimental Reactor (ITER) facility under construction. Image courtesy of ITER.
At its heart is the world’s largest tokamak. The donut-shaped nuclear fusion chamber will use supercooled magnets to confine, sustain and control plasma superheated to 150 million degrees Celsius. That’s 10 times the temperature at the core of the sun. Unlike nuclear reactors, which release energy by splitting uranium atoms, fusion reactors generate energy by joining—or fusing—isotopes of hydrogen, the most common element in the universe. The process replicates the reactions that take place inside the sun and make it shine and heat our planet. As you can imagine, this is an extremely hard engineering task. Every component must fit together with surgical precision, and every sequence of assembly must be flawlessly choreographed to avoid costly delays.
This dauntingly difficult design is also what makes Lynton Sutton so excited about the bleeding-edge visual tools being used to build the ITER. “Gantt charts and engineering drawings are often challenging to comprehend, even by those familiar with the subject matter. But ,” Sutton says. “That’s the power of this technology.”
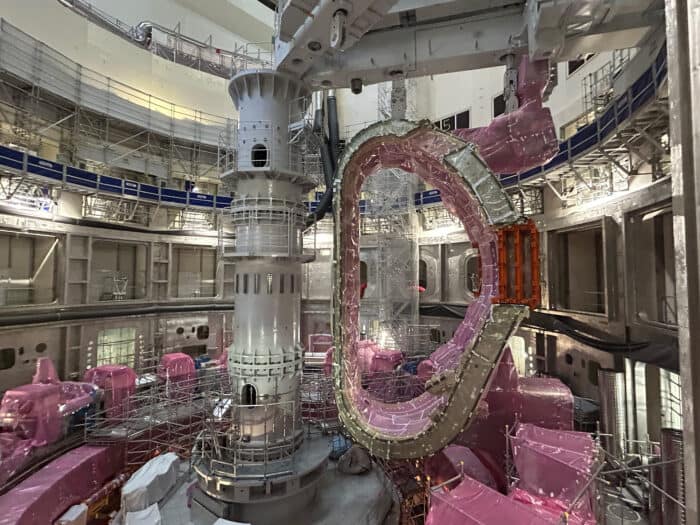 This vacuum vessel sector is temporarily occupying one of the bays reserved for sector modules in the tokamak pit. Image courtesy of ITER.
Sutton will be discussing ITER and 4D visualization technology at the 2025 South by Southwest (SXSW) festival in Austin, Texas on March 10. He will be joined by Greg Demchak, vice president of emerging technologies at Bentley Systems, the infrastructure engineering software company advancing the visualizations. “A digital twin is essentially a living, breathing replica of the physical project—updated in real time,” Demchak says. “When you combine that with 4D planning—adding the dimension of time—you don’t just see what the project looks like; you see how it will be built, step by step. At ITER, where timing and clarity are everything, this technology is invaluable.”
For Sutton, who is specializing in 4D planning at ITER, making this level of complexity digestible isn’t just a challenge—it’s his job. Bentley’s digital twin and 4D planning tools, particularly its SYNCHRO software, have become essential at ITER, allowing engineers to simulate, refine and execute the construction process with greater clarity and foresight. But ITER’s complexity has pushed Bentley to evolve its 4D tools beyond anything seen before, leading to a breakthrough in visualization technology that could redefine megaproject management everywhere.
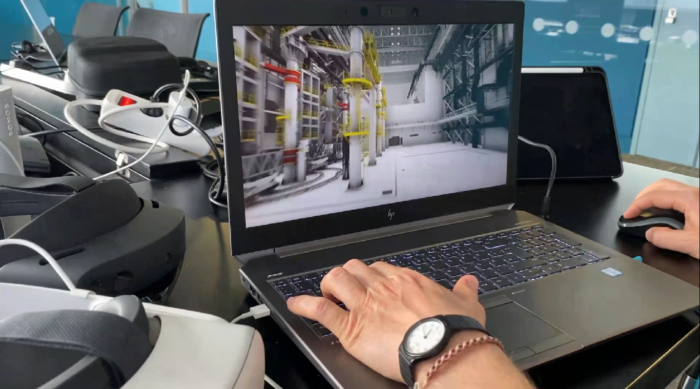 A 3D rendering for planning the design and construction of ITER project displays on laptop screen.
While SYNCHRO 4D was already cutting edge, Sutton wanted to push its visualizations even further to better communicate the intricate engineering of ITER’s assembly. That’s when he reached out to Demchak, head of Bentley’s emerging technologies.
Demchak immediately saw the challenge. ITER wasn’t just another construction project—it was an extreme test case for 4D planning and visualization. “If you want to push a new concept to the absolute limit, ITER is perfect,” he says. “The complexity of its geometry is nothing like a linear bridge, highway or tower. We had to take our tech to another level.” But in doing so, they also uncovered the limits of their existing tools.
Bentley’s initial prototype of a fully navigable model for ITER employed a proprietary 3D mesh tiling format called 3DFT, which rendered SYNCHRO 4D into an interactive environment. However, animating it smoothly proved challenging. “At the same time, we started experimenting with Cesium 3D Tiles, which was a similar concept based on an open-source format,” Demchak says.
The results with Cesium, the 3D geospatial company acquired by Bentley last year, were so compelling, and the appeal of open formats so strong, that Bentley didn’t just shelve 3DFT and integrate Cesium’s technology—they bought the company outright.
Early in the collaboration, Sutton had wondered: “Imagine if we could just let the viewer customize their own experience of the ITER model, so they can easily navigate straight to the bits that interests them?”
The timing couldn’t be better because the coming years will involve some of the most intricate phases of the ITER project: assembling the reactor’s interior.
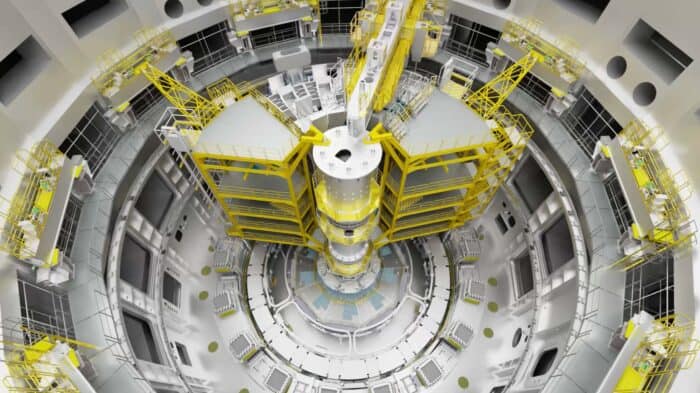 Inside view of the ITER assembly hall, showing complex machinery and yellow scaffolding structures for tokamak construction.
The complexity of assembling ITER’s tokamak takes on a new dimension of complexity once construction moves inside the reaction chamber itself. Unlike conventional projects, where a flat, open workspace allows for relatively straightforward planning, the tokamak presents a curved, three-dimensional chamber of interwoven components, scaffolding and temporary platforms. “It’s far too complex a thing to be shown in a single frame,” says Sutton.
For engineers working inside the tokamak chamber (aka the vacuum vessel), even the best-planned construction sequences could become a logistical headache if not thoroughly explored ahead of time in a virtual space. Sutton foresees the ability to freely navigate a virtual model of the reactor becoming invaluable for spotting potential bottlenecks, refining installation sequences, and ensuring that every team member is aligned before real-world work begins.
That’s exactly what Bentley’s advanced visualization tools will soon enable: seamless exploration of the tokamak model. Users will be able to prepare interactive stories through curated view sequences or freely navigate the model with intuitive tools—all while benefiting from exceptional performance.