From Graph Paper to Digital Displays: The Evolution of Engineering Graphs
Tom Walski, Ph.D, P.E, Industry Analyst and Bentley Fellow
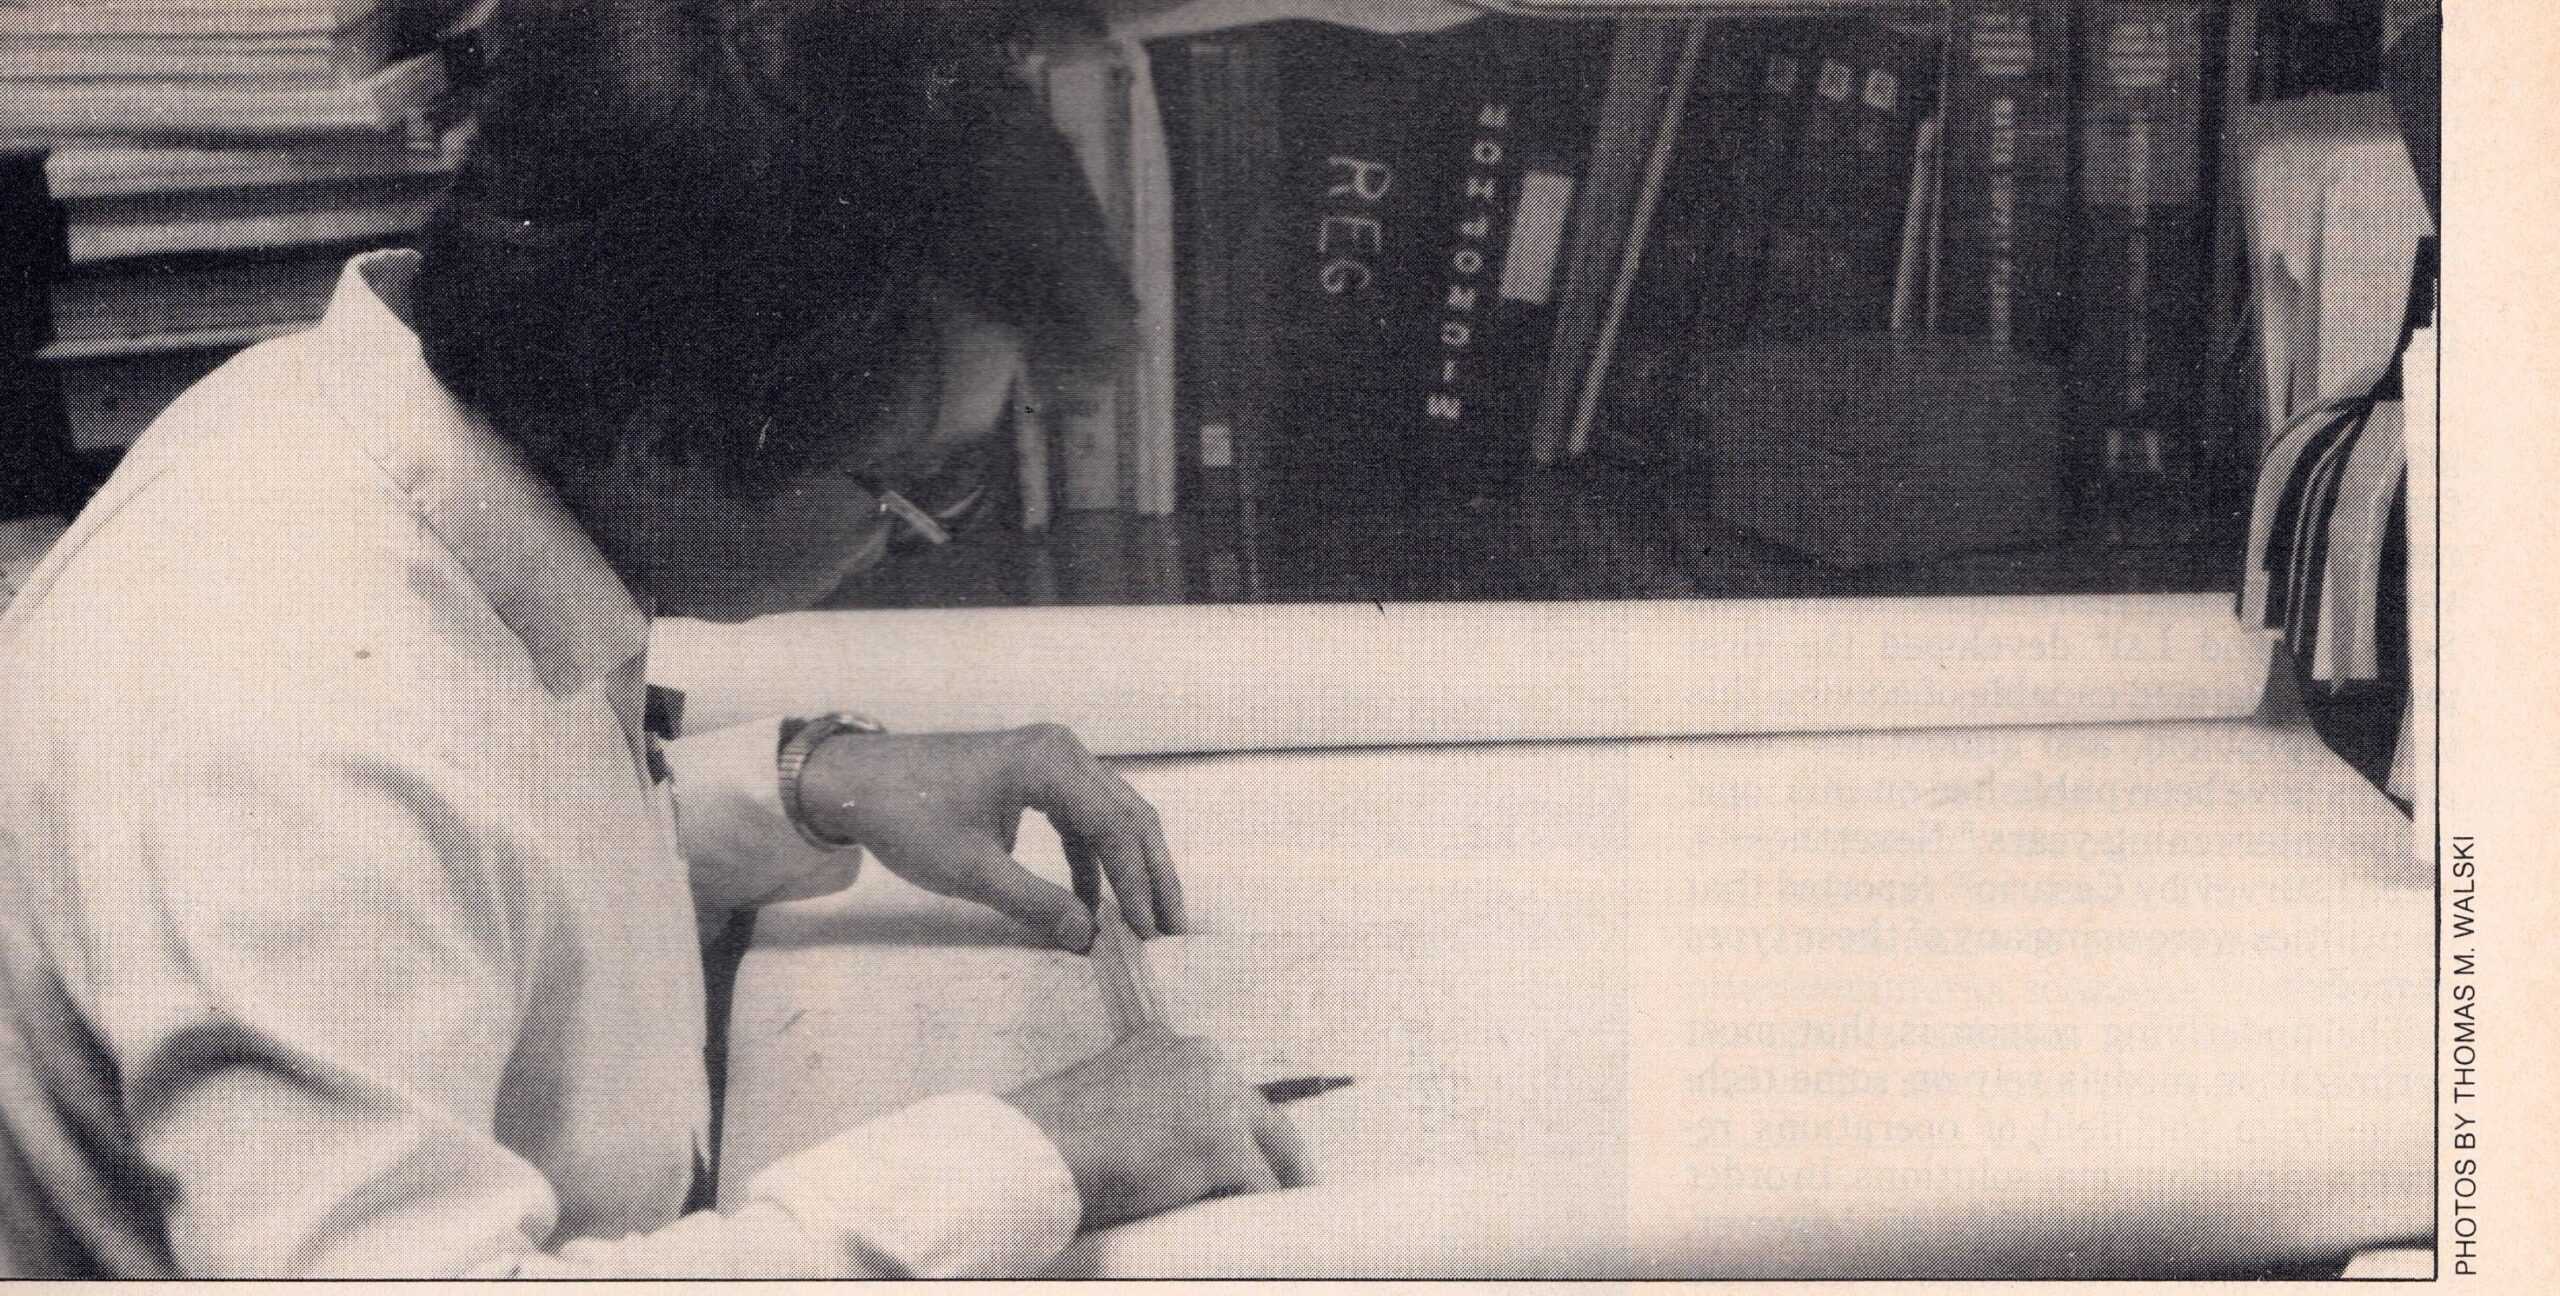
A person reviews large sheets at a desk surrounded by organized books, files, and engineering graphs.
Share
Engineers and scientists love graphs. With one image, they can convey as much information as many pages of text and do it in a way that can be clearly visualized.
Nowadays, with software, we can do so much more with graphing, but that’s not always the way it was done. Here is how simple graphs used to look like in the past, drawn on preprinted graph.
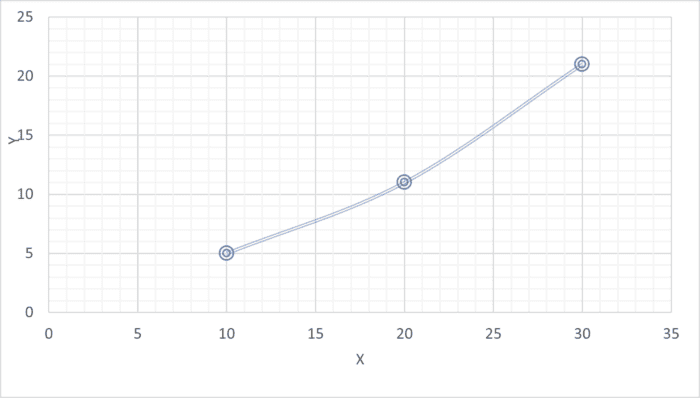
Straight line y=mx+b
Here is a graph you can get from Excel today:
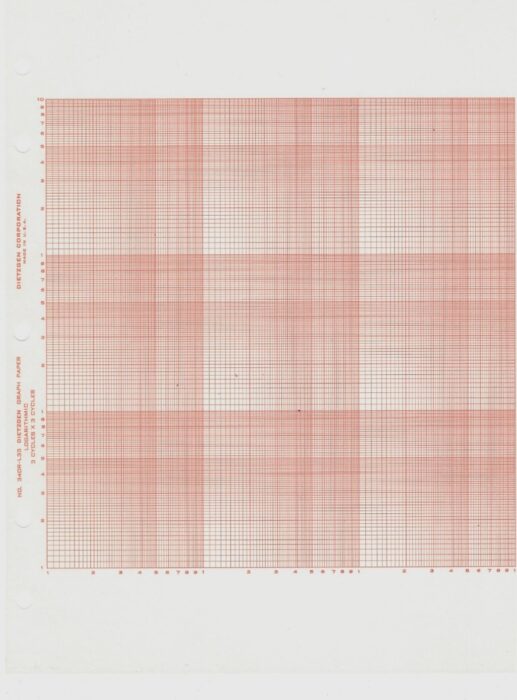
Sure, anybody can draw a graph on arithmetic graph paper. But what happens when you have data that cover several orders of magnitude and data aren’t very evenly spaced. You could take the logarithm of each point and plot it that way, but then you would need to continuously convert the data from the log scale to your original values. For example, “the graph says 3.52 but that’s the log of the real value that is 3311”. The key of course is to have graph paper with logarithmic scales. Your graph paper would look like this:
The figure shows 3 cycle log-log paper.
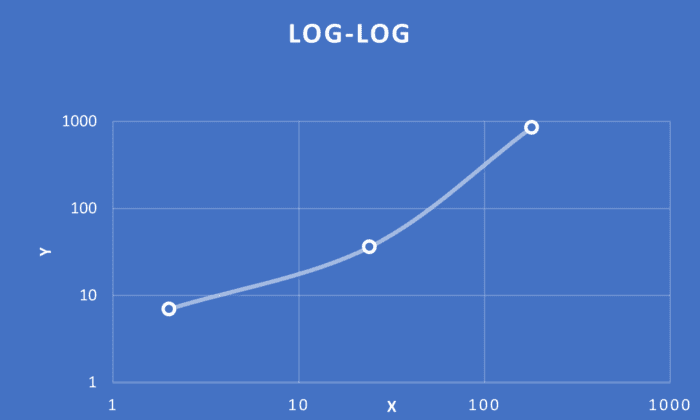
Straight line y = aXb
In Excel the figure could look like this:
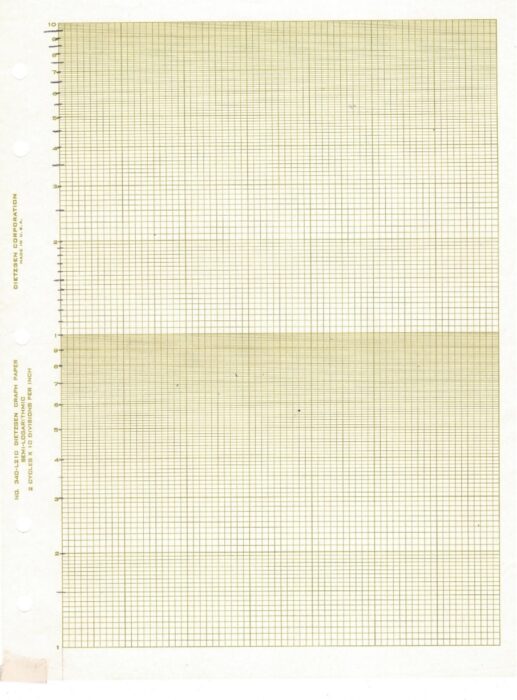
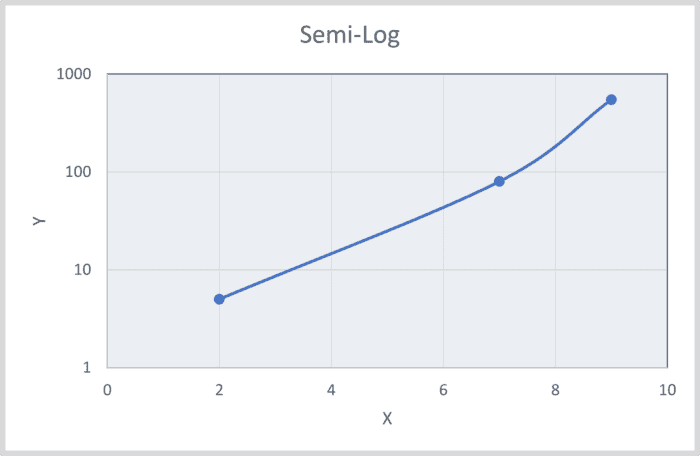
Sometimes, however, only one axis would need to vary over several orders of magnitude. This is where semi-log graph paper saves the day.
Straight line y = a exp(bx)
Using today’s software, the figure might look like this:
So, you just needed log-log and semi-log graph paper, and you were all set. Not quite.
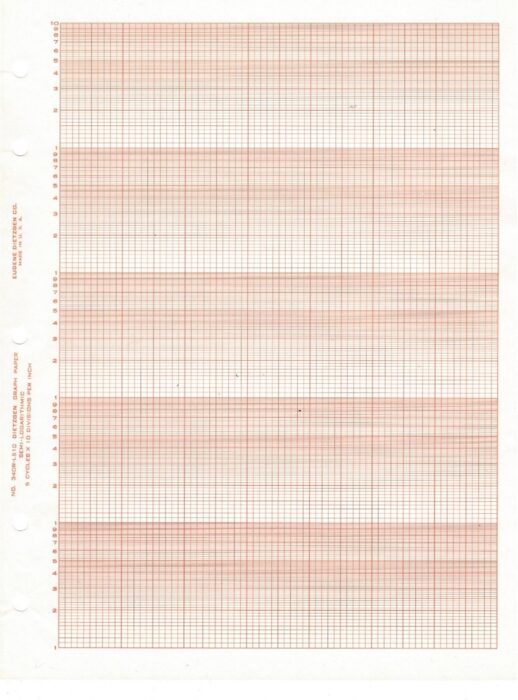
You couldn’t be too certain how many orders of magnitude you needed to cover. You needed 1-cycle, 2-cycle, 3-cycle graph paper.
Here is what 5-cycle semi-log graph paper looked like:
A good engineer needed a drawer full of different scale graph paper to cover every situation.
It wasn’t just log-scales that mattered. If you worked with statistics, you needed normal distribution graph paper to display how well your data fit a normal distribution. But you also needed log-normal paper with different scales.
Although their main products were surveying, drafting and engineering equipment dating back to the 1800s, companies like Eugene Dietzgen and Keuffel & Esser made a lot of money selling obscure types of graph paper.
Today, of course, digital technology has replaced graph paper and many other old engineering tools. I don’t plan to go back to graph paper any time soon. How many young engineers know what a “planimeter” is?
Progress marches on and leaves a lot of log-log graph paper in its wake.