The northern hemisphere slogged through its hottest summer in 2,000 years last year, and 2024 could be even warmer. This week, we look at how digital twins are helping communities adjust to rising temperatures, fight wildfires, forecast and prevent flooding, and manage water resources. But summer’s also for swimming, and digital twins can help competitive swimmers improve their style. Read on to find out how.
Wildfire Digital Twin
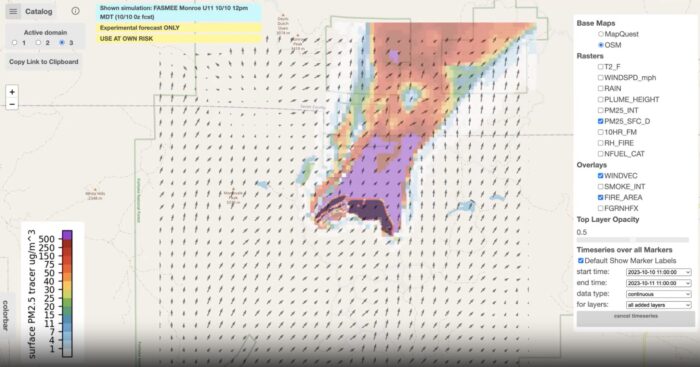 A wildfire simulation describing the spread of PM 2.5 aerosols during a controlled burn. Credit: NASA/San Jose State University
A wildfire digital twin developed by NASA’s Earth Science Technology Office is using artificial intelligence and machine learning to forecast burn paths and smoke plumes in just minutes rather than hours. “Whereas current global models describing the spread of wildfires and smoke have a spatial resolution of about 10 kilometers per pixel, the Wildfire Digital Twin would produce regional ensemble models with a spatial resolution of 10 to 30 meters per pixel, an improvement of two orders of magnitude,” NASA said.
Why it Matters: NASA said that fast and detailed models would be “immensely valuable” to first responders racing to save lives and protect homes and infrastructure. “We want to be able to provide firefighters with useful, timely information,” said project lead Milton Halem, a professor of computer science and electrical engineering at the University of Maryland, Baltimore County. “There is generally no internet, and no access to big supercomputers” for first responders during wildfires, Halem noted. But with the NASA model, wildfire teams can communicate and “run the digital twin not just on a laptop, but even a tablet,” he said. The digital twin can also help monitor global wildfire trends.
Swimming in Data
The Olympics may be over, but data science and sports remain in the news. Data, math, and digital twins — aided by wearable tech — have the potential to put competitive swimmers in the fast lane. Ken Ono, a mathematics and data science professor at the University of Virginia, produced a paper titled “Swimming in Data” by collaborating with several of his students, including Olympic gold medal swimmer Kate Douglass. Ono believes this scientific approach to shaping swimming strategies will soon be the standard. “Five years from now, our story won’t be a story,” he said. “It’ll be, ‘Oh, everyone’s doing it now.” The paper outlines how math and physics, combined with technology to acquire individual-level data, can help athletes improve the biomechanics of their swimming stroke. “It is both an athletic challenge as well as a scientific challenge,” Ono said. Will Tenpas, a swimmer and data science student at UVA, said it’s easy to get swamped by the number of factors involved in swimming. “There are all sorts of flexibility limitations. You have water moving at you, you have wakes, you have currents,” he said.
Why it Matters: The research team used sensors placed on swimmers’ wrists, ankles and backs to capture data and generate digital twins that precisely replicate the athlete’s movements. These models revealed strengths and weaknesses, giving coaches actionable insights for suggesting technique and strategy improvements. “It’s an incredibly valuable resource,” said co-author August Lamb, a former UVA swimmer. “Being able to have this resource where you can test for one month, and then spend a month or two making that adjustment, and then test again and see what the difference is.” Lamb compared digital twins to a feature in the Nintendo game Mario Kart, where you can race against a ghost version of yourself. Olympian Douglass, who also co-authored the paper, identified a flaw in her head position in the 200-meter breaststroke. Using her digital twin, her coaches quantified how much time she could save by making a modification. When her technique was tested in 2020, the 200-meter breaststroke wasn’t even on her event list. During this year’s Olympics, she set the American record and won gold in the event.
Sea Change in Miami
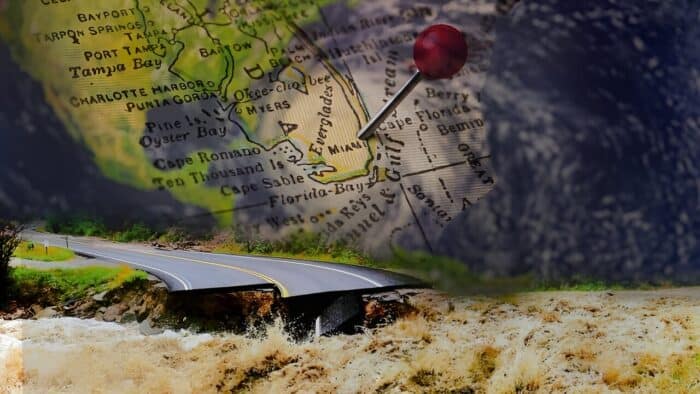 University professors created mathematical model that can help urban planners with infrastructure improvement decisions. Credit: Virginia Tech
A mathematical model created by professors at Florida Atlantic University, Virginia Tech, and the University of Houston can help urban planners make effective and equitable decisions about infrastructure improvement. The framework, published in Production and Operations Management, offers a comprehensive approach to making informed investments amid extreme weather-related challenges. Notable among those challenges: escalating risks of flooding in coastal cities from rising sea levels. The model also integrates social vulnerability indexes developed by the U.S. Centers for Disease Control and Prevention. The research team used the City of Miami’s stormwater infrastructure as a case study, evaluating scenarios to optimize resource allocation across 72 areas. Researchers also considered factors such as social vulnerability and projected impacts of rising sea levels. The versatile methodology is applicable to other critical infrastructure sectors, including energy, transportation and public health.
Why it Matters: The U.S. Infrastructure Investment and Jobs Act allocated $1.25 trillion in 2021 to protect cities with aging infrastructure from extreme weather effects. But urban planners need solutions to distribute these resources fairly and effectively. “Even with this necessary additional funding, cities typically are not going to be able to improve every part of their infrastructure as much as they would like to, particularly because they need to protect against current and future storms,” said Chris Zobel, who led the project and is a professor of business information technology in Virginia Tech’s Pamplin College of Business. “They are also very aware of the importance of incorporating equity into deciding which improvement projects to choose, so that they can provide more socially vulnerable groups their fair share of protection.”
By factoring in demographic and socio-economic data, the models prioritize investments that enhance infrastructure resilience and address socio-economic disparities accelerated by flooding. “It’s important to think about who is impacted by the flooding,” Zobel said. “Then the money can be allocated in such a way that it’s not just going to be effective, it’s also going to help the people who need it the most.”
When Data Flows Like Water
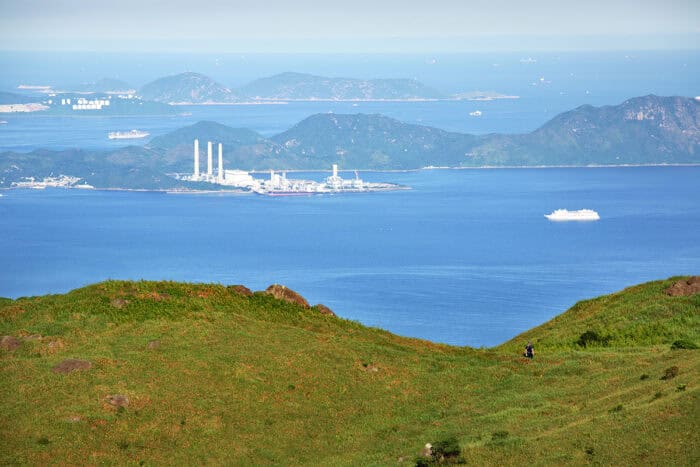 Aerial view of the green mountains on the eastern Pearl River Delta in Hong Kong, South China
A new modeling technique developed by an international team of researchers could identify more cost-effective ways to manage water and help reduce global water scarcity by 50%. The team’s study, published in Nature Communications, found that current water scarcity research prioritizes water quantity over quality. The team explored the issue within the context of the Pearl River Basin in southern China and considered different socioeconomic and climate change scenarios. Researchers looked at water quality management options, such as reducing the use of chemical fertilizers and treating wastewater. They also examined water quantity options like water storage and water-saving techniques. The study introduced a new modeling method that, among other things, considers the effects of biogeochemistry, climate change and human activity on the land. “Our challenge lies in effectively mitigating water scarcity; ensuring sufficient water of good quality to fulfill human, environmental, social and economic demands; and support sustainable development,” wrote co-author Taher Kahil, a water security research group leader in the Biodiversity and Natural Resources Program at the International Institute for Applied Systems Analysis (IIASA).
Why it Matters: More than half of the world’s population lives in areas with insufficient access to clean water. This poses a challenge to the balance between water supply and demand, and creates risk for economic sectors that use water, such as agriculture. The water sector receives less than 1% of climate-tech investments, according to the World Economic Forum. The sector’s digital transformation is crucial for resource management and sustainability. Smart technologies like remote sensors, smart irrigation and digital twins enable real-time monitoring and efficient water use. “Water scarcity is one of the major environmental problems in the world,” Kahil said. “Our analysis can serve as a blueprint for assessing water scarcity in other heavily water-stressed and polluted river basins, guiding the development of cost-effective strategies to mitigate water scarcity.”
Getting Smart About Floods
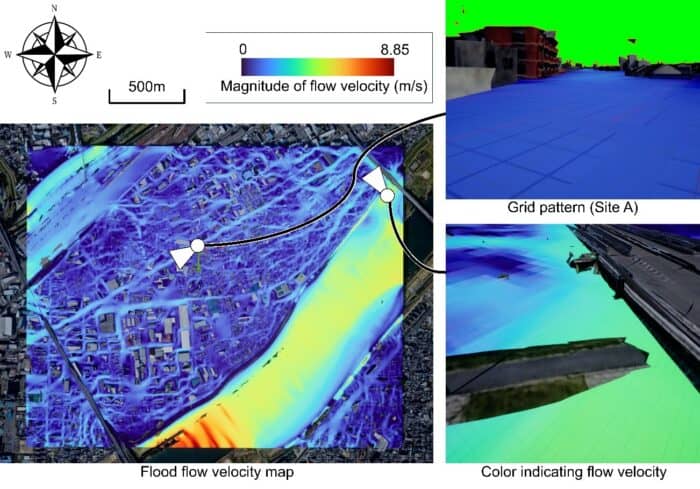 This model reproduces the depth of flooding, but also the velocity of the floodwaters represented by color changes. Credit: Osaka University
Researchers at Osaka University in Japan have developed a mixed reality system for forecasting and visualizing floods that users can access from their smartphones and other mobile devices. The system improves community preparedness and response. “We expect that our study will help people to intuitively understand flooding risks, regardless of their expertise,” said study author Ryoma Tsujimoto. Eventually, he said, the research results will improve people’s overall safety.
Why it Matters: Climate change is increasing flood risks in urban areas. Numerical simulations predict flooding from heavy rain and river overflows, but the results are displayed on flat maps with limited scale can make it difficult for communities to fully understand flood risks. A mixed reality system will overlay data visualizations on real-time images of the urban area, allowing users to see where and how much flooding is likely to occur.


