In this fun experiment, we tried to check if the physical quantity estimation for all the tasks follows Benford’s law or not. Surprisingly (not so surprising) we found that the result has some resemblance with Benford’s law. Through this exercise, we get ourselves familiar with the potential of user fields and user field formulas in SYNCHRO 4D Pro.
What is Benford’s Law?
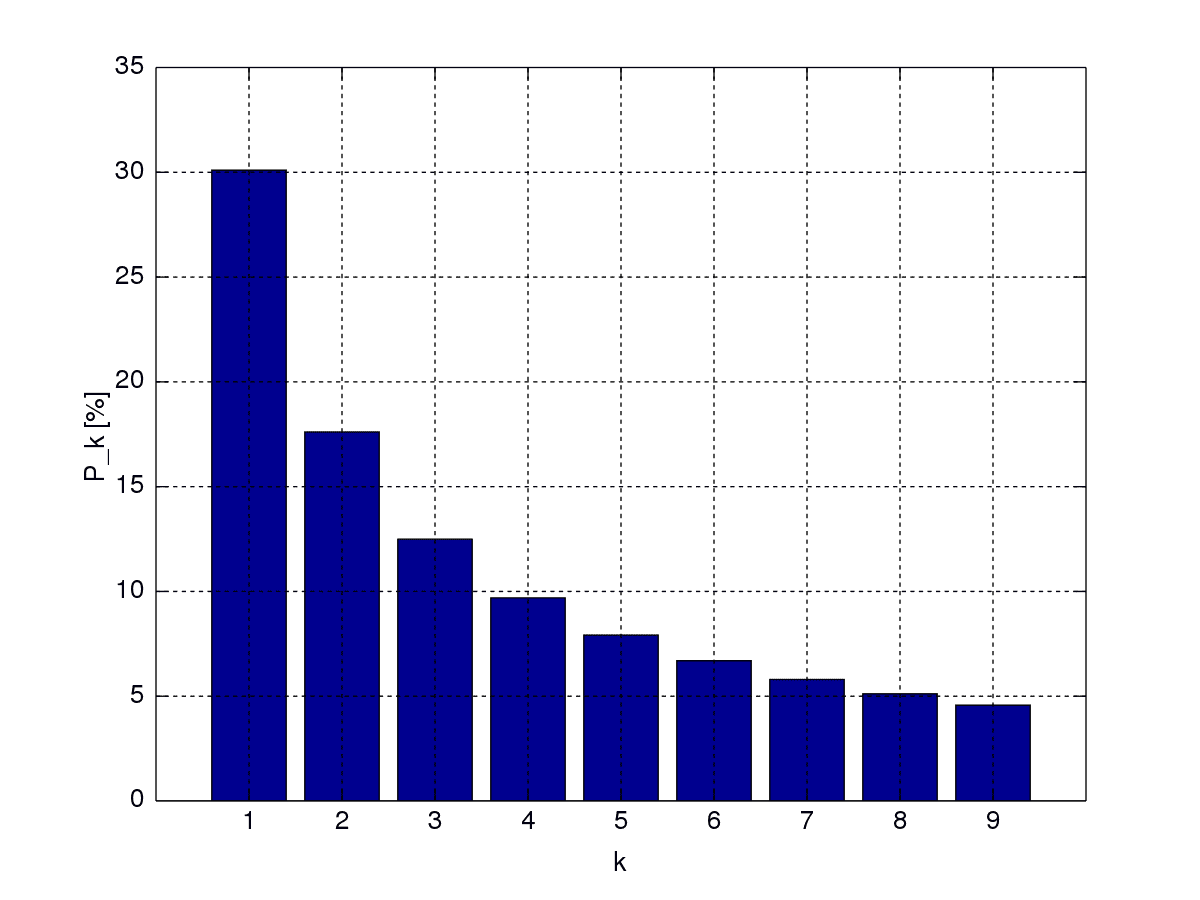
It has been observed that for a large set of numerical data, the frequency of the first digit of the numbers shows a particular distribution. It has been found number 1 occurs the most number of times. This accounts for 30.1% of all the values. The below table and the plot shows the distribution of other numbers.
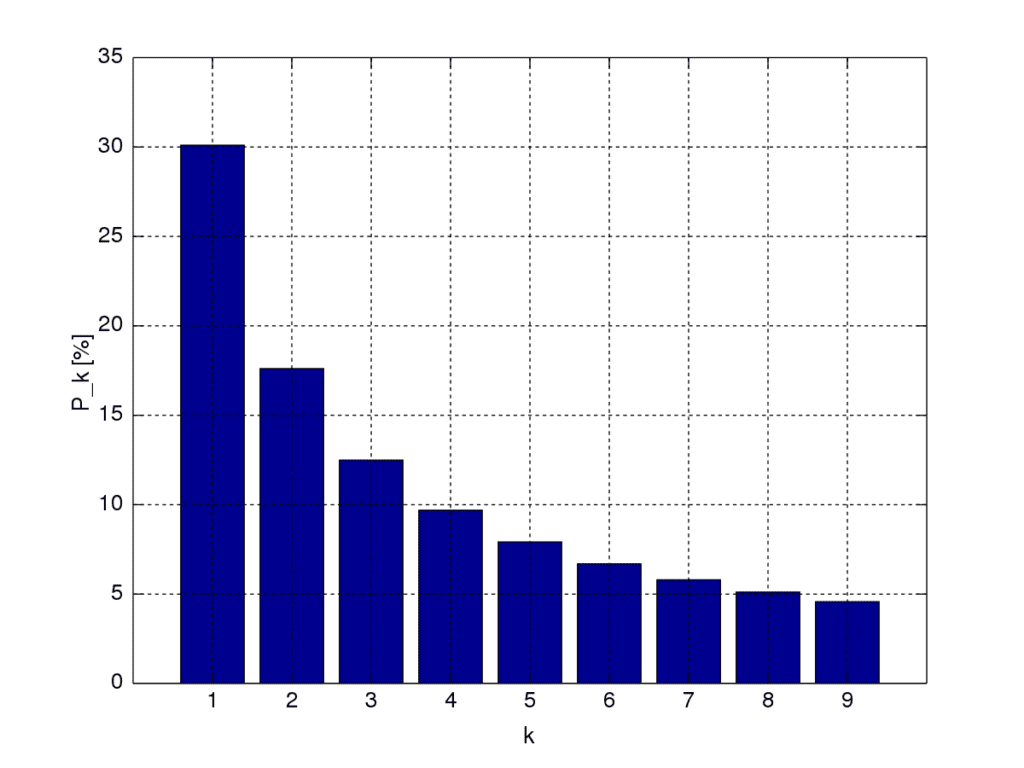 Leading Digit Distribution as per Benford’s Law (Source: Wikipedia)
A good video to understand Benford’s Law
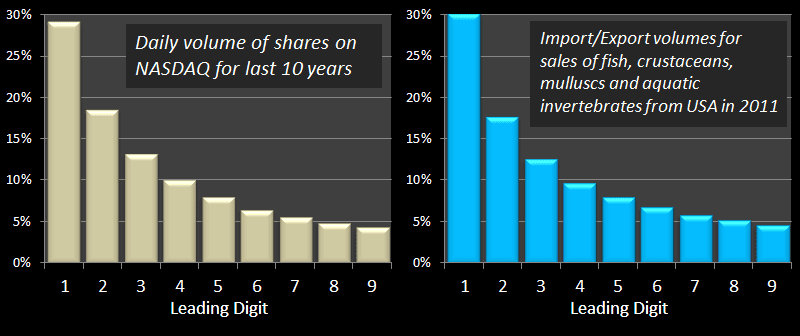 Real-life data that shows trends same as Benford’s Law( Source: https://datagenetics.com/blog/march52012/index.html)
Preparing Data in SYNCHRO 4D Pro
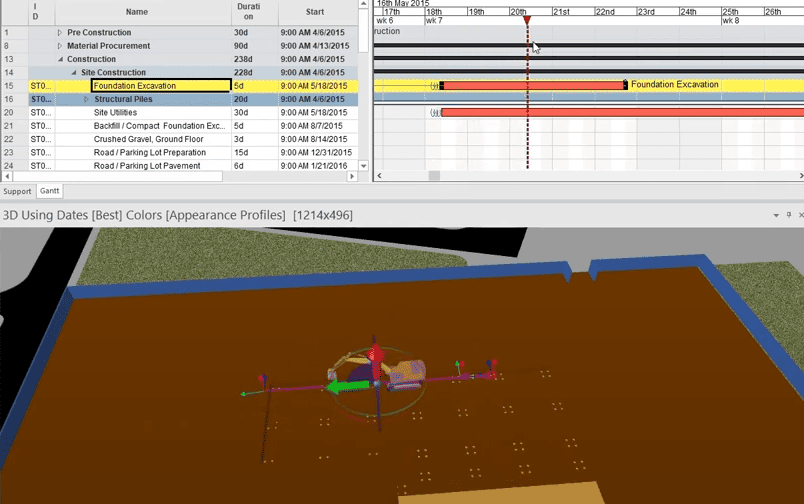
We start with our sample training example file that can be found inside Synchro PRO Training.sp FilesSYNCHRO Training Building Completed.sp.
The tutorial files are available here.
Workflow Video
User Field Formula Used
- Volume:
SUM(3D.CALCULATE_VOLUME) - Leading Digit:
LEFT(STRING(UFV("Volume")),1) - Leading Digit (For modifying the values with ‘0’) :
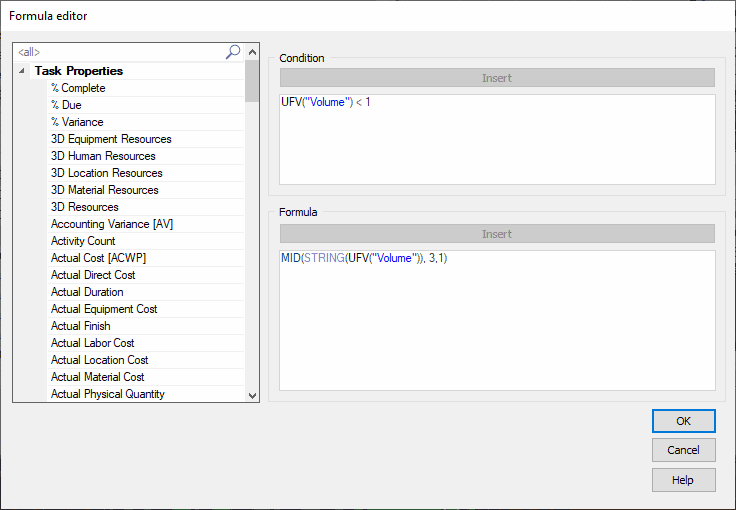
[UFV("Volume")<1]MID(STRING( UFV("Volume")), 3,1)
Result & Discussions
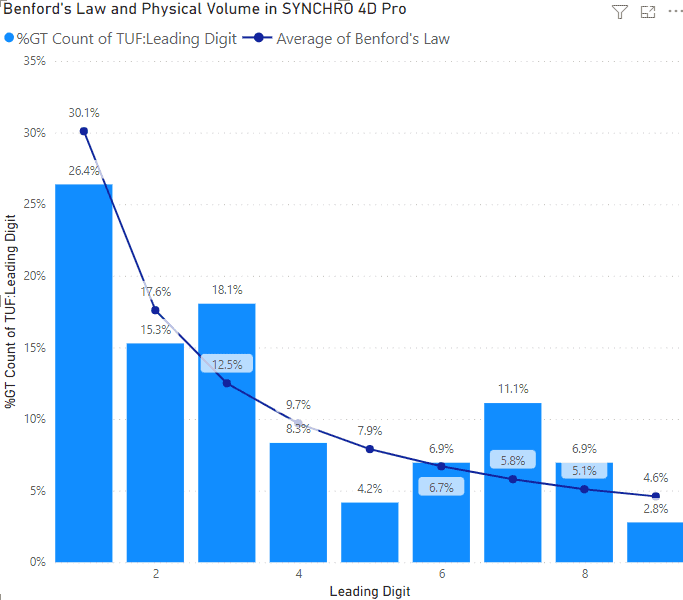
We can see the digit 1 as the most frequent digit and 9 being the least. This has some similarities with Benford’s Law. The total number of values considered was 72. If the number increases and may be for a larger project, we might find a closer resemblance with Benford’s Law.
Let us know the findings of your SYNCHRO Project.
Related Articles
Learn more about User Fields and User Field formula from OnDemand Training | Automation in SYNCHRO 4D
